May 2025: A glimpse into FY2025 earnings
In this newsletter, we review the full financial year results for FY2025. Of the 427 non-financials in the BSE500, 424 have reported so far and we have like to like numbers for the relevant time periods for 354 companies. These 354 companies represent 91% of the market cap of the non-financials universe of the BSE500. We have also looked at the banks separately.
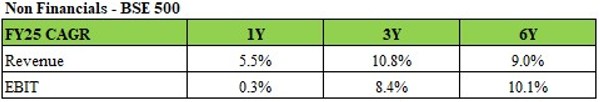
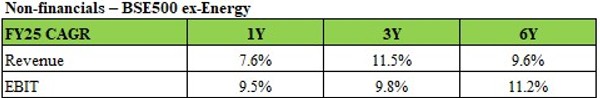
For the non-financials, revenue growth for the financial year for the chosen sample came in at 5.5% and EBIT growth came in at 0.3%. We have chosen the 6-year time frame because it captures in a better way growth from pre-covid to now. The 1Y data is unduly affected by the energy sector which saw its EBIT decline 26% yoy, largely because of lower profits of the oil majors – the oil refining and marketing companies and ONGC. If we exclude the energy sector, the numbers look like this:
We now turn our attention to the banking sector. Here we have also included a 10Y picture because 6 years ago in FY2019, the banking sector was in a lot of stress, particularly the public sector (PSU) banks. NII, as designated in the table below is Net interest income which is the interest received by the bank less interest paid. Pre-provisions Operating Profit (PPOP) is the operating profit after all expenses other than provisions for doubtful debts and taxes. The sample we have chosen is those companies for whom we have like for like comparisons 10 years ago. Our sample is 22 of the 29 banks in the BSE500 and they form 97% of the market capitalization of all banks in the BSE500.
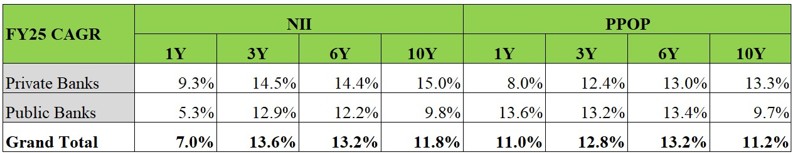
NII growth is low at 7.0% on a 1-year basis with private banks doing a little better than their PSU counterparts. For the PSU banks, PPOP is higher on a 1Y basis because FY2024 had large provisions for employee expenses due to wage revision. This made the base year expenses higher, thus helping profit growth in the current year. While PSU banks have done reasonably well over 3Y and 6Y basis on a low base, we find that over 10 years, private banks have grown at a much faster pace than PSU banks.
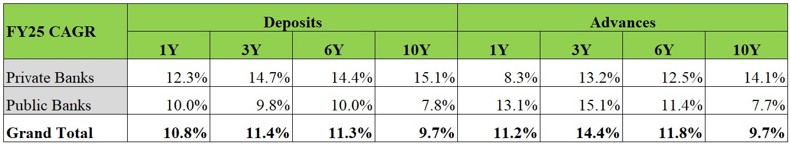
On deposit growth, which is a key success factor in the banking business, private banks continue to do better, on all time frames – from 1Y to 10Y. On advances (loan) growth, PSU banks have grown at a faster pace over 1Y and 3Y basis but over longer time periods, they continue to lag. An overall feature that is striking is the low 10-year growth in total deposits and advances, compared to history.
As we can see, there is a slowdown in activity, with the caveat in terms of the sample that we have used. This was one of the reasons for the broad market falling dramatically from September 2024 to February 2025 because corporate results came short of expectations. We have seen a rally over the last 3 months, though it is often not the beaten down stocks in Feb 2025 which seem to be rallying as strongly as a different set of stocks whether it be the private banks or the insurance companies as examples of this trend.
We believe that the valuations of some pockets of the market continue to be higher than their history and growth, which is slow right now, will need to be a lot stronger to justify these valuations. We had very high levels of cash at the September 2024 peak of the market as we had sold many of the stocks in our portfolio which had become expensive. The fall from September 2024 to February 2025 and beyond in some stocks, gave us opportunities to deploy our cash and our cash levels are now lower than in the recent past. This is not a macro call by any stretch – we found opportunities in our universe of stocks which gave us a good reward to risk ratio, and we were able to deploy the cash. This, as we have said before, is a continuous process for us – to sell when stocks are expensive and to re-deploy the proceeds in other stocks which appear attractively priced in relation to their long-term prospects. We hope to continue on this path.