December 2022: 2022 – a year of outperformance by Indian markets
In 2022
- December 2022: 2022 – a year of outperformance by Indian markets
- November 2022: Tracking recent Indian IPOs
- October 2022: AMCs – Growth at a reasonable price
- September 2022: Dollar surges as the US Fed raises interest rates
- August 2022: Corporate profit growth slows in the June 2022 quarter
- July 2022: Valuations at point of entry determine subsequent returns
- June 2022: Commodities cool off
- May 2022: Inflation – a headwind for corporate profits and markets
- April 2022: HDFC Bank and HDFC Limited Merger
- March 2022: CRB Commodity Index at a multi decade high
- February 2022: Two tiered market
- January 2022: Inflation spooks “growth” stocks
As we bid good bye to 2022, it is interesting to look at some surprising performance by the Indian stock market – The S&P 500 is down 19.4%, the Nasdaq100 is down 33.1% the Eurostoxx50 is down 11.7% for the year while the Nifty is up 4.3% and the Sensex is up 4.4%. Several of our clients have asked us why this has happened. While to some extent, we are also scratching our heads about this question, because such outperformance is rare in the context of a sharp fall in global markets, we will try to look at the earnings reported by corporate India to see if there are any answers there.
We first look at our usual data set of the BSE500 Non-financials, looking at a 3 year compound annual growth rate (CAGR) to eliminate the impact of covid on comparison.

What we notice is that revenue growth has slowly picked up over the last few quarters. However, the operating profit growth has slowed down – this is largely due to the Material and the Energy sectors. In Material, steel, non-ferrous metals and other commodities have been sectors which are impacted by lower commodity prices. Within Energy, the profits of the oil sector PSUs have been impacted due to policy decisions of the government to contain inflation. Yet, the 3-year revenue CAGR is good and the overall profit growth is still decent.
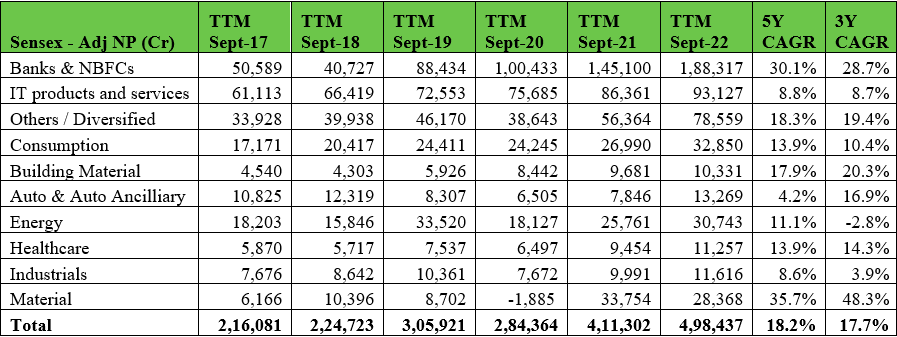
Now we look at the Total Profit Pool of the companies that constitute the BSE30 Sensex. We have chosen the Sensex instead of the Nifty because NSE shifted from reporting unconsolidated earnings to consolidated earnings a few years back, making the data non-comparable across time. Here the Banking Sector which forms a large part of the Sensex is also included in the comparison and we have compared the trailing 12 months (TTM) ended 30-Sep-22 with similar periods in prior years for a better comparison.

What is noticeable here is that earnings have galloped over the last 3 years, rising from Rs 306,000 cr in TTM ended 30-Sep-19 to Rs 498,000 cr in TTM ended 30-Sep-22 and a big chunk of the gains have come in Banking and Others/Diversified sectors. In Others/Diversified Reliance Industries is a large component. The 3-year and 5-year CAGR of earnings is also very strong.
BSE reports a daily Price to Earnings Ratio (PE) for the Sensex from which one can calculate Sensex EPS. This EPS was stagnant in the last several years between the Rs 1350 and Rs 1500 mark – this number as on 31-Dec-21 had reached 2133 and closed the calendar year 2022 at 2567, a growth of 20.3% yoy. So, the PE for the Sensex which was at 27.9 a year ago, is now 23.7. The median of the yearly highs of the Sensex over the last 30 years is 23.3 and of the yearly lows is 16.1. So, although the Sensex PE is down over last year, it still remains close to the top end of historical valuations.
The high-quality universe that we track has also seen a significant bump up in valuations and we have been saying for some time that opportunities are few – most of the high growth high quality companies have been bid up over time and we are forced to look at highly profitable companies which may have a lower growth profile than what we would ideally like. Many of these businesses have been marked down in a period where growth was the flavour of the season. We had already sold most of our expensive stocks several months back and re-invested in other stocks which offer good value and that remains a continuous process for us.
