September 2025: High indebtedness of the world poses risks for investors
It is our responsibility and a regulatory requirement to highlight the risks to your investments. In this newsletter, we will focus on one risk that pertains to all global markets – both equity and debt. We refer to the excessive indebtedness of the world.
When governments take on debt by perpetually running fiscal deficits (the gap between government expenses and revenues), they are essentially borrowing from the future because as the accumulated debt climbs, the interest burden on the debt starts eating into government expenses.
Below we present some data on government debt to GDP for US, Europe, Japan, China and India for 2 years – 2008 and 2024. We have chosen 2008, the year of the Global Financial Crisis as the comparison year because back in 2008 too, the high indebtedness of the world was one of the major contributors to the crisis and the subsequent slow years of growth. We have added the fiscal deficit (also called budget deficit) for 2008 and 2024 and also the interest expense of the government as a proportion of its total expenses.
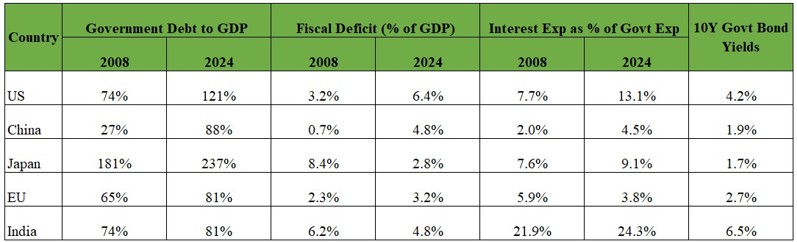
Government Debt to GDP
As we can see government debt as a percentage of GDP is higher in 2024 than in 2008, with US and China particularly standing out. While India has also seen its debt levels go up, the increase in indebtedness is relatively less than other countries.
Fiscal Deficit
The fiscal deficit is important because it tells us the rate at which the debt of the government is increasing (the fiscal deficit has to be bridged by government borrowing). The US has seen its fiscal deficit double from 3.2% in 2008 to 6.4% in 2024. China too has seen a vast increase in its fiscal deficit. It may not be appropriate to do a cross-country comparison of the fiscal deficits due to the different methods of calculation, and it may be more instructive to look at a country’s fiscal deficit change over time.
Interest Expense as a proportion of Total Government Expense
As we can see from the table, interest expense is hogging up a lot of the governments’ budgets and there is a vast increase in this number for most countries other than Europe. For India this number is large because our tax to GDP ratio is low, and our nominal interest rates are higher than the developed countries. These large numbers in absolute and the vast increases over time, are a cause for worry.
Large indebtedness borrows from the future and will put pressure on future growth rates as well as financial stability. This is a risk which has been around for a long time, and one does not really know if and when it will surface but it is good to be cognizant of the situation. The protection we have in our portfolio from this risk is that we try to buy companies generating continuous free cash flows. These companies typically have cash on their balance sheets and will likely escape any disruption because of high indebtedness in general.
There also exists the risk of high valuations which are prevalent in the market, particularly for mid cap and small cap stocks. We have exited most of our expensive positions over the last 12-15 months and re-deployed in stocks in our quality universe which are trading at reasonable valuations. We expect the above actions to hold us in good stead over the medium to long term, if the market were to go through a period of volatility.