September 2023: Mid-caps and small caps are quite the rage in Indian markets
We want to spend some time talking about mid-caps and small-caps because they have lately been the rage in Indian markets. Domestic money has poured into mid-cap and small-cap mutual funds, which has in turn fed into the prices of these stocks. The Nifty Midcap 150 Index is up 33.4% and the Nifty Smallcap 250 Index is up 39.2% over the last 6 months. The Nifty50 index is up 13.1% over the same period.
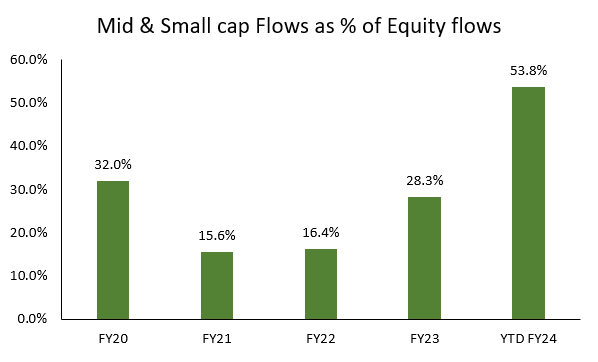
First, we have a look at the domestic money that has poured into small-cap and mid-cap funds. For the financial year to date up to August 2023, as much as 53.8% of the total inflows into domestic equity mutual funds flowed into mid-cap and small-cap funds.
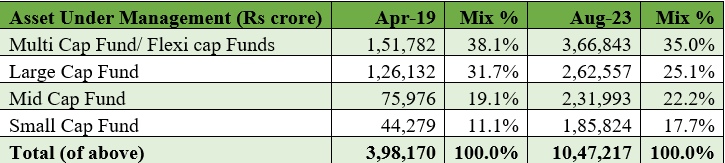
When we look at the size of the total assets deployed in small-cap and mid-cap schemes of mutual funds, we find that the assets under management (AUM) of the small-cap and mid-cap funds are now almost as large as large-cap funds.
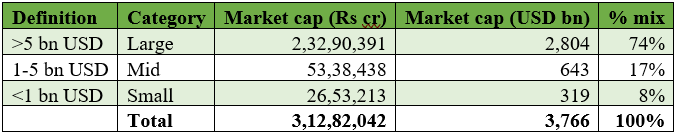
However, when we see the market cap that large caps, mid-caps, and small-caps represent, it tells a very different story – about 74% of the market cap of India is with large caps, and mid-caps and small caps form a much smaller part of the total market capitalization of the country. Therefore, the large appreciation in mid-caps and small caps is not a surprise.
Now, we have a look at the earnings picture for the different indices – the Nifty50 which represents large caps, the Nifty Midcap 150 index, and the Nifty Smallcap 250 indices for mid-caps and small caps respectively.
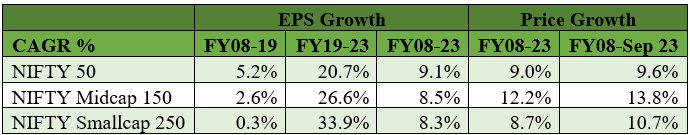
While viewing this data above, we must keep in mind that FY2008 was the peak of the prior cycle. The Nifty EPS grew at 22.4% pa from FY2003 to FY2008. Unfortunately, the data for the Nifty Midcap150 and the Nifty Smallcap250 is not available prior to 2007, and that limits this data to some extent, because the comparison is from the peak of the prior economic cycle.
When one looks at the EPS growth for the entire period, we find that it matches somewhat closely with the market performance of the different indices up to FY2023. What one observes is that FY2008 to FY2019 was a lean period of EPS growth for the indices and from FY2019 to FY2023 has been a period of accelerated growth. A large reason for this is the profitability of the banking sector which constitutes a large proportion of the total weight in the indices.
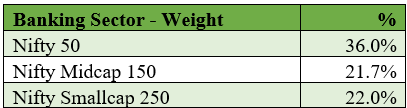
(Source – NSE, As on 30th Sep, 2023)
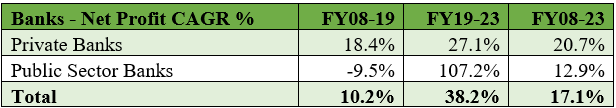
From FY2008 to FY2019 the banking sector recorded relatively muted growth in earnings at 10.2% pa. This is largely because while the private sector banks reported a healthy 18.4% pa growth, the profits of the public sector banks de-grew at 9.5% pa over this period. This was a result of the banks being forced to recognize NPAs of the past, which depressed earnings for FY2019. From FY2019 to FY2023, there has been a very strong growth in profits for banks, particularly PSU banks. However, over the entire period FY2008 to FY2023, private banks have continued to outpace PSU banks.
While the performance of the different indices matches closely with earnings growth for the period FY2008 to FY2023, when we include the strong performance of the mid-caps and the small caps over the last 6 months, we find that the performance now looks stretched. As such, we believe that investors should carefully monitor their mid-cap and small-cap holdings for any exuberance in their valuations. We too have been slowly reducing some of our weights in some of our mid and small-cap stocks as they have become more expensive.