December 2015: Domestic investors step in, where FIIs fear to tread

The Nifty was flat for the month and is down 6.4% in this financial year. Our portfolios have done fairly well relative to the market and are moderately positive for the year. The big event of the Fed rate hike came and went and the global markets took the event in their stride. Often the pre-event fears are belied when the actual event unfolds.

Concerns about the Fed rate increase and the consequent impact on emerging market currencies, has led to outflow of foreign capital from emerging markets. In the current fiscal, FIIs pulled out $ 2.3 billion, and about $ 4.2 billion since 1 May 2015. Over the last 10 years, there has been only one financial year (FY2009) when FIIs have withdrawn money from India, though admittedly 3 months still remain in this financial year. FIIs have invested roughly $15bn annually in India over the last 10 years and they have been steady investors into the Indian market – so, an outflow over a 9 month period is also a bit out of the ordinary. Also, though the Rupee has weakened about 5% in 2015, the fall has not been of any significance compared to the currency weakness in countries like Brazil, South Africa, Australia, Indonesia or Russia. On the whole, the Indian markets (both equity and currency) held up quite well in the backdrop of FII outflows and weakness in other emerging market currencies.

Even as FIIs who were the steadiest source of inflows into Indian equities over the last decade, were withdrawing money from India, strong domestic inflow into equity mutual funds has more than made up as domestic investors have invested about $1bn per month in this financial year. The cool down in the prices of gold and real estate may be contributing to these strong inflows. With inflation down, and demographic tail winds yet to kick in, the Indian economy continues to hold significant promise for investors in the coming years. It is nearly certain that India will be among the fastest growers among large nations, over the next decade. On the other hand, the current log jam in various aspects of the economy makes one wonder how and when the change would happen. Weak commodity prices, large NPAs for banks, significant delays in infrastructure projects and serious balance sheet risks for several companies, are some of the large problems that need to be addressed. Shareholders of many of these companies will be compromised, as the system tries to resolve these issues.

Although the immediate term problems look large, we remain optimistic over the next few years. One clearly needs to be careful not to get caught up with companies with broken down balance sheets. Accounting in some situations also does not seem reliable. As long as one can navigate the ‘mine field’ safely, it should be a fairly satisfactory road ahead. We remain committed to our preferred space of ‘safe’, high quality companies, and are able to see some good opportunities emerge in the face of an almost 16 month long flat market.

November 2015: Should the Fed bite the bullet?

The Nifty remained subdued and was down 1.6% for the month. Aggregate corporate performance continues to be weak. On top of this, there are concerns over a slowdown in economic reforms, due to the election loss for the BJP in Bihar. On the other hand, there seems to be some early signs of consumer confidence picking up, with some consumer oriented businesses indicating a pickup in business momentum this festive season.

The most awaited event in recent market history is the Fed meeting planned for December 15-16. To give you a backdrop of why this particular Fed meeting is important, one needs to step back to the year 2008, when the Fed dropped its Fed funds rate to zero for the first time. Subsequently, when the Fed felt the need to further stimulate the economy, it went ahead and did what is known as Quantitative Easing (QE) wherein they buy government and mortgage backed securities from market participants. The Fed eventually did three rounds of quantitative easing over the years.

You may recall a couple of years back a term ‘taper tantrum’ splashed across pink newspapers. This was the time when the Fed first started communicating to market participants that it may begin to taper off the quantitative easing and eventually stop doing more QE. The term taper tantrum was used because there was a minor earthquake in emerging market currencies, when the Fed announced that it intended to taper. Interestingly, when the Fed actually started the taper, the market did not seem so nervous.

Having stopped the QE, the next step in normalization of monetary policy would be to start increasing interest rates from zero, because not only are zero interest rates not ‘normal’, given history, for interest rates to remain so low for so long is also somewhat unprecedented. Over the last 8-9 months, the most covered financial question by financial journalists is about when the Fed would increase rates. The uncertainty around this question has created a fair bit of volatility in currencies, commodities and other financial markets. Even Dr Rajan, the RBI governor, has expressed his concern about the uncertainty that has remained hanging over financial markets for a while and the impact it may be having on decisions of other central bankers around the world.

So, while the jury is still out on whether the Fed will actually increase interest rates at its coming meeting, our hope is that the Fed will just go ahead and bite the bullet and get this uncertainty out of the way. It is true that the global economic recovery is still fragile but perhaps this uncertainty around the rate hike is not going to help the recovery much either. The patient does need to be taken off life support to at least observe how she behaves on discharge.

Meanwhile we continue to scan the market for opportunities that may arise from the volatility which is in any event a characteristic of Mr. Market. The current market mood remains fairly stock specific, and that is the kind of market that suits us because we pride ourselves in our ability to spot mis-priced opportunities, especially with reference to high quality stocks – our search continues.

October 2015: Challenging environment and a dichotomous economy

The Nifty was up 1.5% for the month, but is still in negative territory (-5.0%) for the financial year (Apr-Oct). Our portfolios continue to do better than the market. After a strong FY2015 (Nifty up 26.7%), owing to the post elections positive sentiment, business sentiment seems muted in the current year and aggregate corporate performance has continued to be weak, largely on concerns regarding commodity producers, infrastructure, real estate and other indebted companies. Though lower inflation should lead to pick up in volumes over time, we are yet to see significant consumer demand revival and investment spending is also poor.

At the same time, there are some sections of industry which are doing quite well. HDFC Bank, for example, has seen its growth rate accelerate over the last few quarters. Its advances in the latest quarter grew at 28% pa, at a time when the rest of the sector is complaining of anemic growth in credit offtake, besides asset quality problems, which HDFC Bank has been able to avoid because of its disciplined lending practice. Even more surprising is that deposits grew by 30% in the same period. A bank of such size growing its deposits (Rs 500,000 cr) at such a high rate in a weak economic environment is definitely evidence of what a great management can achieve (further confirming our bias towards investing in companies that are run by an excellent management team), and the opportunity that the Indian economy provides. IT services companies like Infosys are also growing at respectable rates backed by extraordinary return on capital. On the other side, commodity and related sectors, and other capital intensive, debt heavy companies continue to have problems. In a sense we are in a dichotomous economy where the better companies continue to strengthen and the weaker ones are under severe stress. So, although aggregate corporate performance is nothing to write home about, there are quite a few companies doing well and it is possible to construct a high quality portfolio, growing at satisfactory rates even in these tough economic conditions.

The last few years have been very satisfying for us, both in terms of absolute returns as well as relative returns as compared to the Nifty, our benchmark. However, at this point, we would like to remind investors that over the last 10 years, the number of years of outperformance is only slightly higher than the number of years that we have underperformed. What has led to this large outperformance over time, has been that the years in which we underperformed the Nifty, we did it by very little and the years that we outperformed, the quantum of outperformance was quite high. While we shall continue our efforts to first protect capital, then beat inflation, and finally to outperform the market, investors should remember that this outperformance will not come each year but is more likely to come over time. Even the legendary Warren Buffett has underperformed the S&P 500 one fourth of the time.

We remain committed to our steadfast path of identifying high quality companies which we hope to buy at reasonable prices – the times today continue to be challenging but we have found with past experience, that if one looks hard enough, one should be able to find reasonable investment opportunities which should meet our triple objectives mentioned above, over the long term.

September 2015: India in the context of global volatility

We are half way through the current financial year (Apr – Sep), and during this period the Nifty is down 6.4%. Our portfolios did much better than the market and most of the portfolios are positive for the year. Since markets were strong last year, with the Nifty up 26.7%, some correction in the subsequent year is normal. The correction in the current year is led by a combination of international and domestic events.

Led by a severe commodity price correction and concerns over the Chinese economy, there has been a withdrawal of investments from emerging economies. Many large exporters of commodities like Brazil, Russia, Australia, South Africa have seen their respective currencies fall in double digit percentages over the last twelve months with the worst performers down 40%. Compared to that, the fall of 5.9% of the Indian Rupee against the US Dollar seems benign. India is a large importer of commodities like oil, coal and gold. With lower prices of commodities, the total import bill actually comes down and the same goods can be consumed at lower prices. This is clearly good for India. The Indian consumer benefits from lower prices and the government benefits due to lower subsidies. The exact opposite has been the case over the prior 6 years.

Inflation has been the bane for the Indian economy over the last 6 years and has contributed significantly towards holding back the nation from the much talked about ‘true potential’. Over the past 12 months the CPI (Consumer Price Index) has been averaging about 4.4% (Wholesale Price Index has been negative). CPI Inflation has averaged 7.1% per annum over the past 58 years. Since 2008, CPI has been averaging 9.6% pa, whereas in the 1998 – 2007 period, it averaged a reasonable 3.8% pa. The severity of the fall in commodity prices suggests that the back of the inflationary spiral is broken, at least for now.

It would be difficult for India to progress on the path of sustainable growth unless inflation is controlled. Dr. Rajan has been a vociferous proponent of the need to control inflation in a sustainable way, for which several structural issues need to be fixed. Many of those are beginning to be discussed in terms of changing the rate of interest for small savings instruments (PPF, etc) which can go a long way in bringing down interest rates in the economy.

However, the global situation will probably continue to be volatile over the short term because of significant dislocations that seem to be happening in terms of currencies. The global recovery continues to be fragile, given that 7 years after the crisis, the Fed has neither been able to raise interest rates nor reduce the size of their balance sheet in terms of the QE they did to revive the US economy.

Having said this, we continue to maintain that we are in a very stock specific market, and that is our mantra – to focus on the company and its valuations. As long as we can do that, day in and day out, we should have reason to sleep well at night.

On the other hand, with lower inflation, companies will not be able to easily pass on price increases to customers. On the extreme side, companies like Reliance has seen a 32% fall in revenues in the last quarter as the selling prices of their products fall. Companies that would do well in a period of low inflation would be those that can grow volumes at rates ahead of real GDP growth, and not see a dramatic distortion in pricing power. The nature of companies that grew strongly over the past 6 years is likely to be very different from the companies that are likely to do well over the next few years, when inflation is likely to be lower.

August 2015: Equity Market Volatility – it’s the nature of the beast!

Equity markets witnessed a sharp correction during the month – at its worst point a few days ago, the market was down 10%, but recovered towards the end of the month, closing down 6.6% for the month. For the year (April – August 2015), the Nifty is down 6.1%. Our portfolios did better than the market, both for the month and for the year. Given the market volatility, it is important for investors to understand long term returns expectations from markets and the associated role of volatility.

The Sensex, as we know today, dates back to April 1979 with a starting value of 100. Over the past 36 years, it has appreciated at the rate of 16.5% pa reaching 26,280 today. There have been more than 50 changes in the Sensex components over these years. Performance of the Sensex has been very good, beating all asset classes (with the added advantage of daily liquidity and tax efficient returns) despite having had companies like Satyam, JP Associates or Premier Auto as components in the Sensex over these years. Over the same period, we have seen innumerable crises – economic, political or terror related. Despite these events, investors who chose to ignore these events would have made an ‘easy’ 16.5% pa tax free returns over these years – the trick of course was to not get shaken off the horse along the way.

It is the inherent nature of equity markets to be volatile. Over the past 25 years, the Sensex, in any average year, tends to see a volatility of 57% (by which we mean the high – low range, so the 57% number implies a range of 100 to 157 during the financial year). Interestingly, volatility over the past 5 years has been on the lower side, at about 31% compared with the historical average of 57%. Volatility is higher for individual components of the Nifty – typically one observes that more stable businesses also tend to have lower volatility. So, while many investors tend to associate volatility on specific days to their general sense of calm or anxiousness, it may be better to look at things from a slightly longer perspective – in calendar 2015 (8 months so far), the high low range volatility is about 19% which is well within historical norms.

We continue to maintain our focus on the long term in terms of our investment philosophy – our emphasis is on buying high quality companies that have stood the test of time, and are expected to grow earnings near or above the nominal GDP growth rate which is around 14-15% pa. Moreover, we wish to buy these stocks at prices that are reasonable. The volatility in stock prices represents an opportunity as explained by Benjamin Graham, provided one is buying into high quality companies and also one is well aware of the value of what one is buying. The corollary to that of course, is that as stocks get closer to the expensive zone, one would also look to trim or exit positions to reduce risk in the portfolio.

With intrinsic value of stocks, on the aggregate, expected to go up over time at a rate that is well above inflation, it makes sense for an investor to be regularly buying into fundamentally sound companies, growing in line with nominal GDP, as long as prices are sensible. Unlike the peak levels seen in 2007 or 2010, stocks are not expensive at present. There are pockets of expensive valuations in some areas, but the general level of the market offers a reasonable reward to risk ratio. We remain focused on the higher end of the quality spectrum and hope to buy at prices that are reasonable.

July 2015: Chinese Whispers

The last few months has been dominated by talk about China and the fears in relation to that. The Indian stock market continues to consolidate in a range, a situation which has prevailed for many months now. Our portfolios continue to do well.

At this point, while the Greece issue came and went, analysts and observers are more keen to talk about China and the threat it represents to the global economy. The trouble of course, is that China as an economy, continues to be fairly opaque and difficult for outsiders, and perhaps even insiders, to decipher. The Chinese government says that they are growing at about 7%, the lowest in many years, but still a respectable rate. There are other observers who challenge that claim, and say that the Chinese economy is growing at a much lower rate, and point to the sharp fall-off in commodities as evidence of that. What is somewhat worrying about China is that they have accumulated a lot of debt since the crisis of 2008, to try and stimulate the economy to ward off the effects of slower export growth since 2008. The latest evidence that something may be wrong, is the sharp fall in the Chinese stock market, despite all efforts by the Chinese government to stem the fall.

While the situation is obviously not so easy to figure out, given the opaque nature of the Chinese economy, one can clearly say that over the long run, India stands to benefit from the fall in commodity prices, which is a direct result of the slowdown in the Chinese economy. The reason for that is that India is a large importer of commodities, and a falling price of oil, coal, steel, etc are positive for the Indian economy at large. The fall in the price of gold is particularly relevant, because a lot of Indian savings were being channeled into gold, which from an economy’s point of view, is essentially, money lying idle, simply seeking protection from inflation at best, and non-productive speculation, at worst. With gold now down for 4 years in dollar terms, India should benefit from a lower allocation to gold which is a natural result of an asset class underperforming. We have already discussed in earlier newsletters about the positive impact of a falling oil price.

That said, one can not rule out a negative impact of what is happening in China on all global equity markets – and should the situation spin out of control, the Indian stock market could also feel the ill effects of that. When we look at companies that are likely to be directly impacted by a possible crisis in China, the names that come to mind are obviously the commodity producers and also possibly PSU banks who may have lent to these commodity producers. The impact on other companies is likely to be more indirect, and in our opinion transitory. When we look at our own portfolio, we do not find much reason to worry, because most of the portfolio is insulated from any direct economic impact. We have always maintained that mark to market hits, which may result from events that are extraneous to the core businesses that our companies are in, are par for the course, and a patient investor should take them in his stride, in order to benefit from the rewards that accrue from investing over the long term. At the end of the day, the fortunes of our portfolio are linked to how the underlying companies perform – it appears to us, that over the medium to long term, we have every reason to be satisfied with the past and continuing performance of the underlying companies in the portfolio. So while we are not taking our eye off the ball on what is happening in China, we also know that the best results are obtained by thinking micro rather than macro.

Energy market push and pulls

The primary sources of energy are oil, gas, coal, nuclear, hydro and other renewables like geothermal, biogas, wind and solar. The global energy markets are seeing a lot of interesting trade-offs between these primary sources of energy.

The median price of crude from 1861 to 1973 (adjusted for inflation in today’s currency terms) is USD 19 per barrel. Since the oil shocks of the 1970s when OPEC started flexing its muscle in the oil market, the median price has ratcheted up to USD 50 and consumers have been paying over USD 100 since 2008. Middle Eastern OPEC members whose cost of production of oil hovers around USD 5-10/barrel maximise their oil revenues by keeping the price of oil very volatile. They maximise their revenues by limiting the supply and thus extracting high prices from consumers and when any significant investment happens in extracting oil from fields in other geographies where the cost of extraction is high, the supply is increased where the price of oil falls below the floor at which these projects are viable.

Short term forces at play

The current sell off in the crude prices from USD 110 to USD 45 has triggered a lot of discussion about the bigger geopolitical or economic game being played by various players in the energy market. The theories range from:

  1. The Saudis wanting to pressure Iran in the Sunni versus Shia domination in the Middle East
  2. NATO led by US, using the Saudis and Kuwaitis to put pressure on Russia for its Ukraine move
  3. OPEC led by the Saudis wanting to make US investments in Shale oil and gas exploitation economically unviable

Long Term Historical Data

Any or all of the above might be true in the shorter term but let us try to understand how the global energy market has been developing over the past decades. British Petroleum annually publishes the BP statistical survey which details how we source energy globally. The detailed data is published annually and the data tables go all the way back to 1965 and the latest data is available till 2014. The data collated from BP statistical survey can be seen here (https://www.bp.com/content/dam/bp/business-sites/en/global/corporate/pdfs/energy-economics/statistical-review/bp-stats-review-2018-full-report.pdf). Oil was the largest source of global energy and was increasing its share till 1973 when the world experienced its first oil shock – it then accounted for 48.4% of global energy needs. Since the multiple oil shocks of the 1970s, oil’s share of the global energy mix has been continuously and steadily declining ending 2014 with a market share of 32.6%. Even the prior oil market collapse in 1998-99, when the oil price nearly went into single digits didn’t help oil to gain market share in the global energy mix. Oil’s loss in market share has been incessant for the last 40 odd years.

Despite the shale gas revolution in the US, which increased US gas production by 30%, the share of gas in the global energy mix has remained flat since 2001. In fact the share of gas peaked out at 24% in 2012 and has marginally declined to 23.7% in 2014. Even if one were to look at the combined market share of oil and natural gas, as some oilfields produce both, that too has declined from 69.2% in 1974 to 56.4% in 2014.

Over the last decade and a half, coal has been gaining market share driven primarily by Chinese and to some extent by Indian consumption. What has also gained share is renewables (geothermal, biomass, wind and solar energy), which though is a very small part of the global energy mix at 2.5%.

Renewables Disruption in Energy Markets

In the context of oil’s continuously falling share of the energy mix, Ex-Saudi oil minister’s quote “The Stone Age came to an end not for a lack of stones and the oil age will end, but not for a lack of oil”, is very pertinent.

In a global energy market which has been growing at 2% p.a., renewables though have been growing at 15% p.a. for the past decade. This growth is driven by wind energy which has grown at 24% p.a. for the last decade and solar energy which has grown at 53% p.a. for the last decade. In the global electricity market which has been growing at 3% p.a., wind and solar have already become significant incremental players. Combined, wind and solar accounted for 18%, 24%, 28% and 33% of the incremental electricity production in 2011, 2012, 2013 and 2014 respectively.

Wind energy became commercially viable (i.e. can compete with grid power without subsidies) in early 2000’s and has maintained its growth rate at 20%+ since then. Solar energy is not commercially viable in most parts of the world without subsidies other than in few countries like Japan, parts of US and some Western European nations where the taxes on fossil fuel energy are very high. None of these countries other than some parts of US enjoy high insolation rates through the year. But the beauty of semiconductor technology where lot of innovation is focussed is that the prices keep falling. According to pv.energytrend.com the prices of silicon PV cells have declined from USD 76.67 per watt in 1977 to USD 0.30in 2015, i.e. prices have declined at 13% CAGR for nearly four decades. (http://en.wikipedia.org/wiki/File:Price_history_of_silicon_PV_cells_since_1977.svg). According to Citi Research and Bloomberg New Energy Finance, solar module prices have shown a learning rate of 22% since 1972, i.e. as the installed capacity of solar modules doubles the prices fall by 22%. This pace has further gathered steam since 2008 and the learning rate increased to 40%. As the technology becomes commercially viable, offering a larger and stable market (no uncertainties about tax exemption renewals) will offer the industry further economies of scale.

Energy Substitution

In the US due to the increased supply of shale gas which has depressed natural gas prices, the coal based power plants are being driven out of business as can be seen in the bankruptcy of Texas Utility, Energy Future Holdings (erstwhile TXU). In Germany, which has dynamic pricing of power, the increasing solar power generation is putting pressure on gas fired power plants which are used to provide peak loads as they can be backed off unlike nuclear or coal based power plants. According to Citi’s Disruptive Innovations Report published in May 2014, some gas fired power plants ran for less than 10 days in 2012 as solar power supplied most of the peak load. It is not uncommon in Europe where on sunny days in summer, to maintain the stability of the grid, power gets dumped across national borders, where the buyer of power gets paid.

Similarly energy substitution is taking place where CNG is substituting diesel and petrol as transportation fuel. Electric and hybrid cars are replacing petrol fired cars.

Game Theory of oil

The other interesting part of the oil demand and supply picture is the incentives of different producers. Saudi Arabia has among the largest proved reserves and more importantly, the cost of extraction is in the $5-10 range. Venezuela has world’s largest oil reserves at 298,000 m barrels(10% higher than Saudi Arabia), but the cost of extraction of oil in Venezuela is significantly higher. Meanwhile, while the average cost of extraction for shale oil is USD 65 a barrel, the marginal cost of operation is somewhere between USD 20 to USD 30 for several producers. Economics 101 tells us that a producer will continue to produce as long as his marginal cost is covered, in order to get as much fixed cost coverage as possible. While this is true for shale oil, it is even more true for the relatively higher cost producers like Russia who need to produce as much as possible to balance their budget. In this game theory of oil, Saudi Arabia holds strong cards because it is the lowest cost producer with one of the largest reserves.

Akal Badi ya Bhains

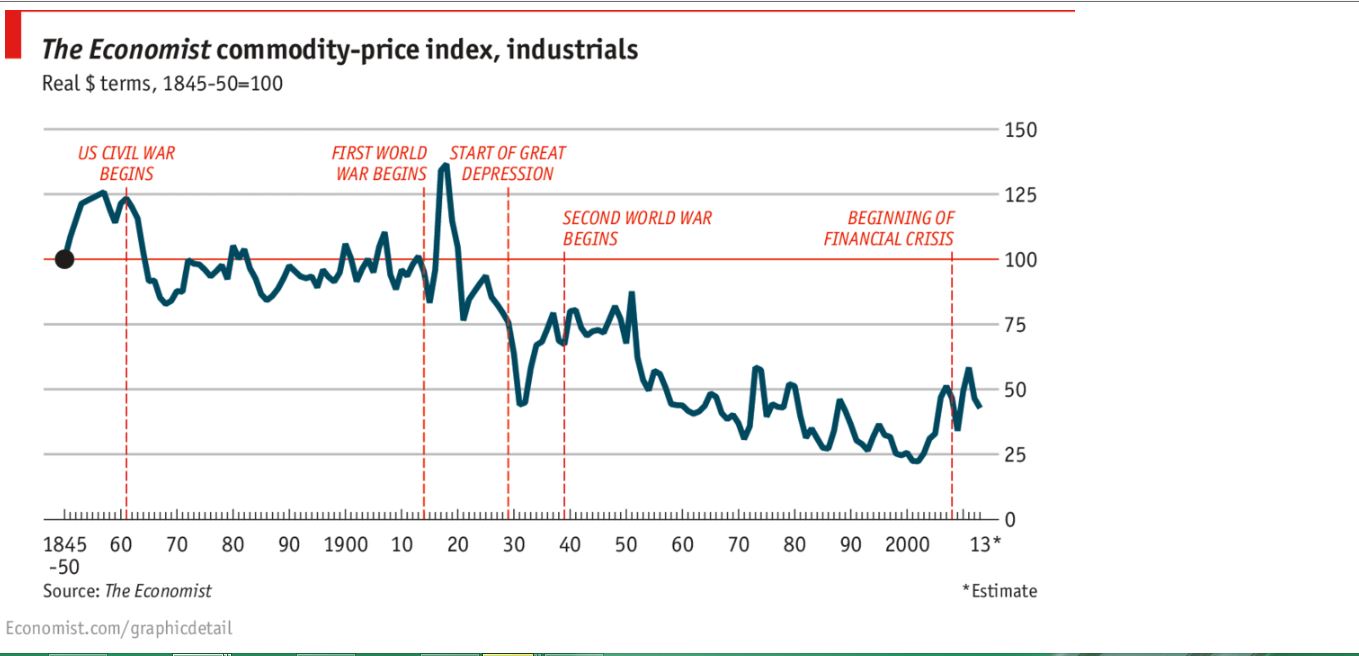
The Economist has been publishing the index of industrial commodities since 1845. The inflation adjusted commodity price index has been a downward sloping graph for over 150 years despite the increase in the consumption of all industrial commodities over time.
Inflation-Adjusted-Commodity-Price-Index
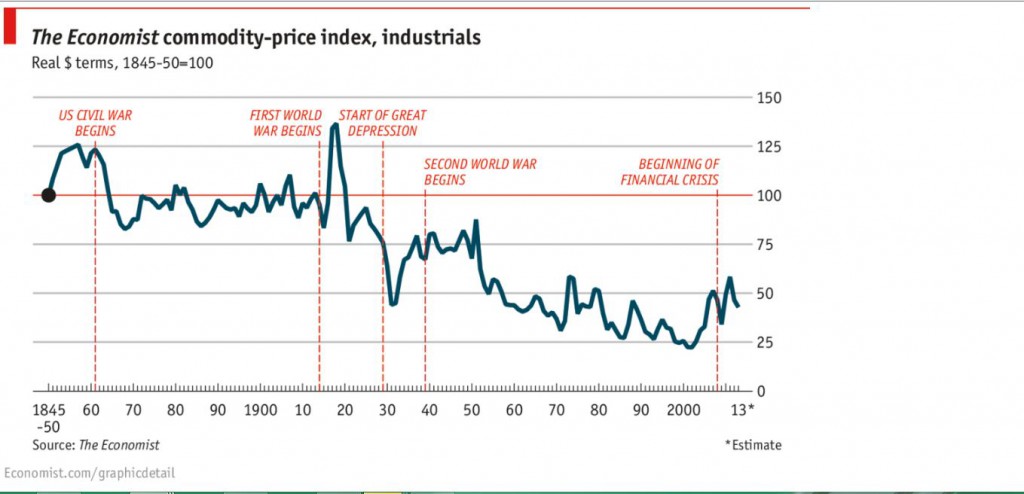
The reason for the decline in price is innovation and productivity enhancement. The Hindi idiom that encapsulates it is akalbadiyabhains, the literal translation is what is bigger brains or buffalo. The cacophony over the past decade of a lasting bull run in commodity prices is essentially the crowd thumping the table on the buffalo.

The oil market did not fit into the declining commodity index as the OPEC with it low cost of extraction, large reserves and dominant production kept the prices volatile in the oil market, offering only capital destruction for someone who took the other end of the trade. The long term impact of this OPEC policy has been to capture economic rent from the consumers and long term decline in oil’s share of global energy supply.

As we saw earlier energy sources are replaceable and the big substitution that is imminent upon us is renewables driven by solar capturing a higher share of the energy mix. Given that the prices of semiconductors keep declining, it will keep a lid on all fossil fuel prices and downward pressure with passing time. Long term the fossil fuel price chart too may look like the industrial commodity chart shown above.

June 2015: Greek Exit? – Fallout on India?

The Indian equity market was down 0.8% for the month – and is now roughly flat for almost eight months now. Our portfolios continue to do well. The market was worried initially about whether the monsoon would turn out as bad as the Indian met department was predicting at 88% of the long period average. As of June 29, which is about three weeks into the monsoon, the cumulative seasonal rainfall for the month of June is 183mm, which is 118% of the long period average. While of course, July and August are still to play out, the first month has been good and augurs well for the whole season.

Most global markets continue to fret about the Greek situation, and it appears that the Greek drama has reached its final Act. The Greeks have to now decide whether they want to be part of the Euro, as the Greek Prime Minister Tsiparas plans to go to the Greek people in a referendum. The Greek banks are as of now, shut. Over Monday and Tuesday, after the announcement by Tsiparas, while equity markets in Europe were volatile, there was no significant change in the government bond yields of Spain and Italy – 10 year government bond yields in these countries continue to be one third of what they were in 2012. Also, the size of Greece’s government debt at $360 billion is not very large when you consider that some investment banks have assets of close to $2 trillion – therefore the situation is not as bad as the 2008 crisis when many of these investment banks were in trouble. The fact that one does not see contagion yet does give one some assurance, but the world will continue to watch the situation over the next few days as some analysts weigh impact, both economic and non-economic such as from a military strategy / foreign policy view.

Meanwhile, India’s current account situation continues to strengthen with the deficit now down to 0.2% for the quarter ended 31-Mar-15 and 1.3% for the full year ended 31-Mar-15 as against the worrying 4.8% it had reached in the quarter ended 30-Jun-2013. Also the RBI’s forex reserves have been swelling – reserves are up $48bn to $352bn from 31-Mar-14 to now – Interestingly $32bn out of that number has been accumulated since 31-Dec-14. The RBI has thus built a lot of leg room to better face any situation that may arise as a result of a continuing poor global situation – it has cushion in terms of forex reserves and also by keeping the repo interest rate at 7.25%, the RBI has a lot of room to cut interest rates to drive growth if inflation remains contained. A good monsoon would dampen inflation and may encourage the RBI to cut rates in the busy season policy later in the year.

Expert value investors like Warren Buffett recommend that one should not over-analyse macroeconomic concerns, and focus one’s efforts on the study of the prospects of individual companies and the prices at which they are trading at as compared to their intrinsic value. The premise in that statement is that crisis and excessive optimism are a part of the normal evolution of economies. A truly great company finds ways to manage itself well through both bad times and good. We have several companies in India with some excellent prospects in the coming years. The Indian consumer is on a strong wicket – a young population, increasing income, high savings rate, little borrowing and under-served. Some of these companies are trading at prices that are at a reasonable discount to intrinsic value. Big draft downs in these stock prices, due to negative economic news offers an opportunity for long term investors.