March 2024: Market cap to GDP – where is India in terms of valuation
In this newsletter, we discuss an indicator of market valuations which is the Market Cap to GDP ratio which is popularly referred to as the Buffett Indicator. In this ratio, we take the total market capitalization of all companies listed in India and divide it by the country’s GDP. “The ratio has certain limitations in telling you what you need to know. Still, it is probably the best single measure of where valuations stand at any given moment.” – Warren Buffett, 2001. And yes – we must add the caveat that market cap to GDP is a very rough measure of valuation.
Market Cap to GDP is akin to somewhere between Market Cap to Sales and Market Cap to EBIT (Earnings before Interest and Tax) for a company, both of which can be useful for understanding the valuation of a company over long periods. The argument made against Market Cap to GDP (MGDP) is that as more companies list every year the market cap increases but the GDP remains on its usual trend. This is indeed true for very less developed markets. In Saudi Arabia for instance, the listing of Aramco led to a huge boost in the MGDP without any impact on overall market valuation. This was true for India too in the 1990s as India came out of the antiquated Capital Controller of Issues days to the SEBI era of free pricing of IPOs. However, if the market capitalisation added by newly listed companies is steady over time, then the bias of new additions would be in built into the MGDP ratio and the ratio can be used as a metric to understand market valuations. When we studied the top 30 companies by market capitalisation which got listed over the last 20 years, we found that the addition of market capitalisation due to new listings, is fairly steady over the last 2 decades. Hence, the MGDP ratio should be able to give us a rough idea of where market valuations stand.
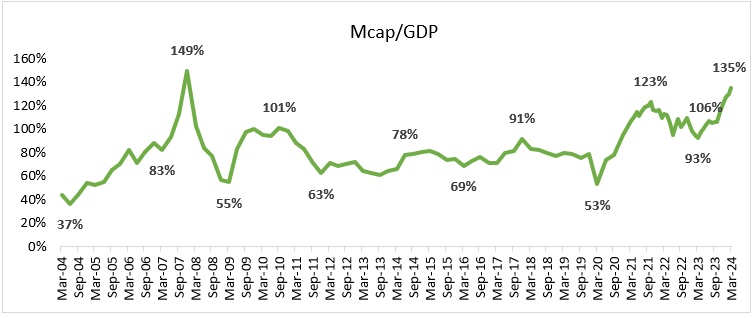
A picture is worth a thousand words. Interestingly, the Indian stock market bottomed roughly at the same MGDP in 2020 as it did in March 2009 after the Global Financial Crisis. The 20-year median for the ratio is 83% and its current value is 135%, suggesting that market valuations are perhaps on the higher side compared to 20-year history.
In a relatively expensive market compared to history, we have sold or reduced some of our holdings which had become expensive, and have found some shelter in other high-quality companies within our investment universe that are reasonably priced. When we are not able to find attractive opportunities to invest in, the balance stays in cash, waiting for the right opportunity to invest within our investment universe of high-quality companies.