April 2024: Our investment process explained through AMCs

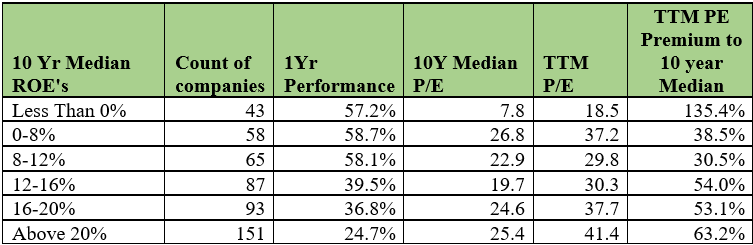
We thought we will discuss our investment process through the example of the asset management companies (AMCs) that we have held for over 5 years in our portfolio. Why did we buy the AMCs? First, they have a very high rate of profitability as represented by their core Return on Equity (ROE) adjusted for cash on the balance sheet, which is actually infinite in a few cases because cash on balance sheet is more than the networth. Second, they have a large opportunity in terms of the increasing preference for equity among the saving community, more in line with international norms than it has been in the past.

An asset management company which can retain assets and grow them over time, can have a perpetually growing franchise. The underlying asset the mutual fund invests in, is growing over time at a healthy rate, and then there are inflows from existing clients and new clients. These levers make AMCs kind of perpetual growth machines. Long term performance of the different schemes of the AMCs, of course, play a vital role in success in this business. Also important is the brand in the eyes of the customer and distribution strength. The business requires virtually no working capital. AMCs deduct their fees from their various schemes on a daily basis. So, no receivables, no inventory and your employee expenses don’t grow at the rate at which your assets are growing. Hence, there is tremendous operating leverage.

There is however a small negative – AMCs are dependent on distributors who command their pound of flesh in terms of the share of the customer pie AMCs have to share with them. Historically mutual funds have been a ‘push’ product with the distributor playing a significant role in the decision- making process for the investor. However, asset management companies which have a good brand and good long-term performance can ensure that the revenue pie is equitably split between the AMC and the distributor.

In September 2018, SEBI came out with a regulation which asked AMCs to reduce the Total Expense Ratio (TER) sharply as the size of their mutual fund schemes increase in size. This caused revenue yields for AMCs to compress and this resulted in relatively poorer revenue and earnings growth for the AMCs for a few years. We also wrote about this in our October 2022 newsletter where we said that despite these near-term issues, the valuations look attractive. Valuations of a high-quality stock are usually attractive (low) when there is some near-term issue or uncertainty that the company or sector is facing. At the time, there were also fears of SEBI coming down hard on AMCs again but some of the worst fears did not eventually materialise. In FY2024 the AMCs have benefited from the large rise in equities in general as also robust inflows into equity schemes. As a result, operating leverage has kicked in for the AMCs and they have reported strong profit growth for the year ended 31-Mar-2024.

Back in October 2022, the AMCs were trading at low valuations with respect to their history. Valuations are now higher and closer to the top end of their valuation zones. This has given us an opportunity to trim some of our holdings in the AMCs as per our process of reducing weights when the market is more cheerful. This process of a stock moving from the lower end of the valuation zone to the higher end of the valuation zone takes several years, as we have seen with our AMC holdings. We hope to continue with our discipline with respect to our investment process in the future as well.

March 2024: Market cap to GDP – where is India in terms of valuation

In this newsletter, we discuss an indicator of market valuations which is the Market Cap to GDP ratio which is popularly referred to as the Buffett Indicator. In this ratio, we take the total market capitalization of all companies listed in India and divide it by the country’s GDP. “The ratio has certain limitations in telling you what you need to know. Still, it is probably the best single measure of where valuations stand at any given moment.” – Warren Buffett, 2001. And yes – we must add the caveat that market cap to GDP is a very rough measure of valuation.

Market Cap to GDP is akin to somewhere between Market Cap to Sales and Market Cap to EBIT (Earnings before Interest and Tax) for a company, both of which can be useful for understanding the valuation of a company over long periods. The argument made against Market Cap to GDP (MGDP) is that as more companies list every year the market cap increases but the GDP remains on its usual trend. This is indeed true for very less developed markets. In Saudi Arabia for instance, the listing of Aramco led to a huge boost in the MGDP without any impact on overall market valuation. This was true for India too in the 1990s as India came out of the antiquated Capital Controller of Issues days to the SEBI era of free pricing of IPOs. However, if the market capitalisation added by newly listed companies is steady over time, then the bias of new additions would be in built into the MGDP ratio and the ratio can be used as a metric to understand market valuations. When we studied the top 30 companies by market capitalisation which got listed over the last 20 years, we found that the addition of market capitalisation due to new listings, is fairly steady over the last 2 decades. Hence, the MGDP ratio should be able to give us a rough idea of where market valuations stand.

A picture is worth a thousand words. Interestingly, the Indian stock market bottomed roughly at the same MGDP in 2020 as it did in March 2009 after the Global Financial Crisis. The 20-year median for the ratio is 83% and its current value is 135%, suggesting that market valuations are perhaps on the higher side compared to 20-year history.

In a relatively expensive market compared to history, we have sold or reduced some of our holdings which had become expensive, and have found some shelter in other high-quality companies within our investment universe that are reasonably priced. When we are not able to find attractive opportunities to invest in, the balance stays in cash, waiting for the right opportunity to invest within our investment universe of high-quality companies.

February 2024: Patience – a virtue in the investment journey

We want to talk about patience, an important aspect of the behaviour of investors which is critical to their long term returns from equities. Investing in equities is a volatile journey. When you put money into a bank fixed deposit, you are certain about the return you are going to make. It is a different matter that you may not be considering what you are losing to inflation but optically, your return is fixed. In equities, however returns are variable from year to year. You are compensated for the volatility in equity returns by the higher returns they provide over the long term, in comparison with inflation. A wise investor who can stomach the volatility, can make the higher returns over the long term. And when we say “stomach” we mean it, because once in a while, equities go through a stomach-churning decline. Having patience through these periods is a must because a bad decision there can significantly reduce your long-term returns.

Patience is a virtue extolled by many philosophers and thinkers over time. We, as value investors like to buy high quality stocks when they are trading at a discount to their intrinsic value. However, when a high-quality stock is trading at a discount to its intrinsic value, there is usually a reason for it. Either the whole market is down, or there is an issue with the sector the stock is in, or there may be some issue with the specific company in question. In effect there is a lot of bad news out there, when a stock is trading low.

At this point we try to determine whether the problem the company is facing, is a temporary problem or whether there is a permanent damage to the business model, and we will invest in the company only if we are convinced that the problem is temporary in nature. Then comes a long wait a) for the temporary problems to go away and b) for the market to recognise the true intrinsic value of the company. And then there are times, when your patience is really tested. We have had two such experiences in the past few years – first with the IT services sector, starting around 2015 and then again with ITC a few years ago. Both, with IT services and ITC, some clients questioned our judgement as to why we are continuing to hold on to these large underperforming positions. However, we stuck to our conviction about these companies and eventually our patience paid off and delivered the desired result in terms of stock performance.

What we have described so far, is the patience displayed by investors. Patience can also be displayed by our investee companies, when they sacrifice the short-term results to build a stronger organisation and invest for the long term. It applies to one’s own career as well, where delayed gratification can be very rewarding over the long term.

Patience is however, hard work. In the face of a lot of criticism (and there is no better critic than the stock price itself), it is not easy to stand your ground and it takes great fortitude. However, an investor must know when to be stubborn about the decision they have made and when the thesis has failed. In the words of Kenny Rogers, the famous country music artiste, “You got to know when to hold them, know when to fold them”. Practising patience with a poor-quality stock is absolutely the wrong thing to do because you not only lose money, you also lose emotional capital. The business of investing which can be encapsulated in “Buy low, Sell High” looks simple enough, but it is not easy. While navigating these treacherous waters, we are reminded of Warren Buffett’s words “The stock market is a device for transferring money from the impatient to the patient”.

January 2024: Party continues for mid caps, small caps and PSUs

The market over the last year has been quite strong – the Nifty is up 21.6% yoy while the Nifty Midcap 150 index is up 50.9% and the Nifty Smallcap 250 index is up 56.2%. We had spoken in September 2023 about the strong inflows into mid cap and small cap mutual fund (MF) schemes. The momentum on that side continues and mid cap funds and small cap funds together received 38% of the total equity MF inflows during the current financial year. This is significantly higher than in the past. Since the stocks that qualify as mid-caps and small caps constitute only 26% of the market capitalisation on the Indian bourses, there is a lot more money chasing stocks in the mid cap and small cap space. As a consequence, small caps and mid-caps have had a very good run in the Indian market over the last 12 months. This is somewhat contrary to what’s happening in the US, where the move has largely been led by the mega caps, popularly known as the Magnificent Seven – ie Amazon, Apple, Google, Meta, Microsoft, Nvidia and Tesla. The Russell 2000, which represents smaller companies, has not done nearly as well as the S&P500 over the last 12 months. While the S&P is up 20.8% over the last 12 months, the Russell 2000 is up only 3.3%.

We looked at the BSE500 index and divided it into buckets based on their return on equity (ROE) and compared their returns over the last 12 months. The quality of most businesses can be judged by their return on equity as one of the primary indicators, though of course there are other indicators as well. Below we have tabulated the results of our study:

As we can see, the companies with high ROEs have had relatively muted returns compared to the companies with lower ROEs.

Another segment of the market which has seen a flurry of action is the PSUs. We looked at the constituents of the Nifty PSE (Pubic Sector Enterprises) Index. Within this, we excluded the banks and the oil and gas companies – banks because their earnings are recovering from the collapse a few years ago and the oil and gas sector because fuel prices have not been revised for an extended period and is subject to government policy. So in both cases, current year profits are not comparable with the 10 year medians.

What we find here, is that while the median Return on Equity (ROE) of this set is almost the same as the last 10-year median, their Trailing Twelve Months (TTM) PE is a good 149% above the 10-year median. Many of these PSU stocks, after remaining largely ignored for several years, are in the lime light and regularly feature in the top 10 traded stocks of the day.

In all, the market remains quite strong and is trading at elevated levels compared to history. The rally seems to be stronger in companies with lower ROEs than among those with higher ROEs, which is a bit of a sign of worry. We advise caution to investors with regard to their mid cap and small cap holdings, particularly in those instances where the quality of the business may be poor or the valuations may be elevated as compared to history. We have used the strong market conditions to reduce our weights in some of our portfolio holdings or even fully exit some of them and our effort is to redeploy these sales proceeds into other high quality stocks in our investment universe, which may still be available at reasonable valuations. If we are not able to find adequate opportunities, the money stays as cash in the account, waiting for an appropriate opportunity.