December 2022: 2022 – a year of outperformance by Indian markets

As we bid good bye to 2022, it is interesting to look at some surprising performance by the Indian stock market – The S&P 500 is down 19.4%, the Nasdaq100 is down 33.1% the Eurostoxx50 is down 11.7% for the year while the Nifty is up 4.3% and the Sensex is up 4.4%. Several of our clients have asked us why this has happened. While to some extent, we are also scratching our heads about this question, because such outperformance is rare in the context of a sharp fall in global markets, we will try to look at the earnings reported by corporate India to see if there are any answers there.

We first look at our usual data set of the BSE500 Non-financials, looking at a 3 year compound annual growth rate (CAGR) to eliminate the impact of covid on comparison.

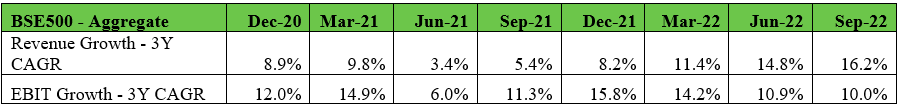
What we notice is that revenue growth has slowly picked up over the last few quarters. However, the operating profit growth has slowed down – this is largely due to the Material and the Energy sectors. In Material, steel, non-ferrous metals and other commodities have been sectors which are impacted by lower commodity prices. Within Energy, the profits of the oil sector PSUs have been impacted due to policy decisions of the government to contain inflation. Yet, the 3-year revenue CAGR is good and the overall profit growth is still decent.

Now we look at the Total Profit Pool of the companies that constitute the BSE30 Sensex. We have chosen the Sensex instead of the Nifty because NSE shifted from reporting unconsolidated earnings to consolidated earnings a few years back, making the data non-comparable across time. Here the Banking Sector which forms a large part of the Sensex is also included in the comparison and we have compared the trailing 12 months (TTM) ended 30-Sep-22 with similar periods in prior years for a better comparison.

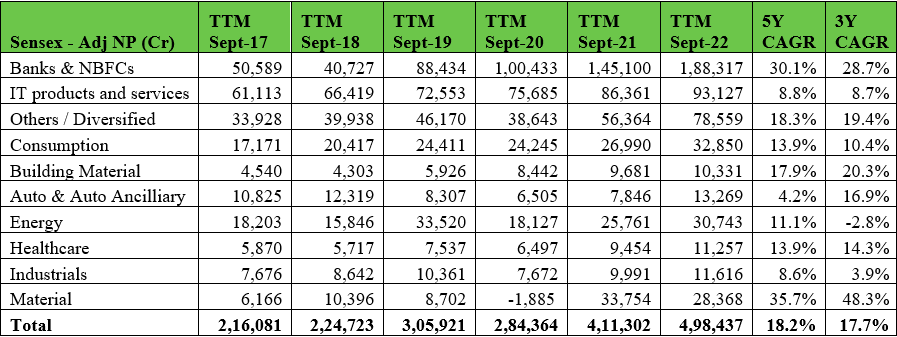
What is noticeable here is that earnings have galloped over the last 3 years, rising from Rs 306,000 cr in TTM ended 30-Sep-19 to Rs 498,000 cr in TTM ended 30-Sep-22 and a big chunk of the gains have come in Banking and Others/Diversified sectors. In Others/Diversified Reliance Industries is a large component. The 3-year and 5-year CAGR of earnings is also very strong.

BSE reports a daily Price to Earnings Ratio (PE) for the Sensex from which one can calculate Sensex EPS. This EPS was stagnant in the last several years between the Rs 1350 and Rs 1500 mark – this number as on 31-Dec-21 had reached 2133 and closed the calendar year 2022 at 2567, a growth of 20.3% yoy. So, the PE for the Sensex which was at 27.9 a year ago, is now 23.7. The median of the yearly highs of the Sensex over the last 30 years is 23.3 and of the yearly lows is 16.1. So, although the Sensex PE is down over last year, it still remains close to the top end of historical valuations.

The high-quality universe that we track has also seen a significant bump up in valuations and we have been saying for some time that opportunities are few – most of the high growth high quality companies have been bid up over time and we are forced to look at highly profitable companies which may have a lower growth profile than what we would ideally like. Many of these businesses have been marked down in a period where growth was the flavour of the season. We had already sold most of our expensive stocks several months back and re-invested in other stocks which offer good value and that remains a continuous process for us.

November 2022: Tracking recent Indian IPOs

With all the news around Paytm being the worst performing large IPO in the world over the last decade swirling around, we thought we will look at the IPO market in India over the last 2 years to see if we could discern some patterns therein. But first, a look at the total amount raised from IPOs over the years.

It appears from this table that more money gets raised from IPOs when markets are buoyant.

While studying the IPOs of the last 2 years and their performance from the IPO price to date, we find that the median IPO has delivered a 17.4% return since listing (where the IPO is listed less than a year back, we have taken only the absolute return – else we have taken CAGR returns). Within these, we divided the universe into 2 sets – companies that reported a net profit in the financial year prior to listing and those that reported a loss. We find that while the median profitable company delivered a 20.3% return, the median loss-making company delivered a negative 12.4% return.

When we dig deeper into the set of companies which had made a loss in the year prior to listing, we find that the worst returns, ranging from -12.4% to -76.5% are for tech start-ups, while the positive returns are largely concentrated among stocks belonging to the “Consumption” sector. One of the reasons for the poor performance of the loss-making tech start-ups is a similar trend in the Nasdaq where over the last 12 months or so, loss making technology companies have had sharp falls and the Nasdaq 100 is down 31.4% from its peak.

While we have no comment to make on the viability of these loss-making tech companies who have long had a philosophy of cash burn, to drive exponential growth, we have a strong belief that we want to invest in companies which generate a good ROE or at least are demonstrating a path towards generating a healthy ROE. There are multiple ways to make money in the markets – we simply follow what we believe in. We were asked in the past by some of our investors whether we would like to invest in these “hot” technology IPOs – our stance then was the same as it is now. As a rule, we find that IPOs usually come to market when the timing is favourable for the seller rather than the buyer and it is rare to find an attractively priced IPO. Even in the instance that an IPO is attractive from the price point of view, it will usually get subscribed a large number of times giving one a very poor allotment ratio, making the whole exercise unviable. So, we prefer to evaluate these stocks when they get listed and if they meet our criteria for a quality company, they get added to our universe of quality stocks.

October 2022: AMCs – Growth at a reasonable price

In this newsletter we would like to review asset management companies (AMCs) which are part of our portfolio. The reason we like AMCs are manifold – 1) Strong financials – AMCs which have achieved scale have very high return on equity (ROE) – in fact in many cases, the core ROE is infinite because the cash on the balance sheet exceeds the net worth of the company. Moreover, this is a business which has zero inventory, very low receivables and requires very little by way of fixed assets either. 2) Long runway of growth – The Indian financial sector is underpenetrated and investment into mutual funds is low compared to developed markets. The total Assets Under Management (AUM) of the Indian mutual fund industry as a proportion of GDP is 16% against 120% in US and 74% for the global average, as on 31-Mar-22. 3) With scale, operating profits are expected to grow at a faster pace than AUM.

There are however some question marks around the third point in recent years. In 2018, SEBI made some changes to the mutual fund regulations. One change was that SEBI determined that as a mutual fund scheme grew in size, it must reduce the Total Expense Ratio (TER) that it can charge to the mutual fund scheme. The fee of the AMC and the distribution expenses are both part of the TER. SEBI also divided the various schemes of the mutual funds into different categories and mandated that an AMC can have only 1 scheme in each category. As AMCs consolidated their schemes in the same category into 1 scheme, these schemes became larger in size and thus the TER on these mutual fund schemes reduced, thus affecting the revenue yield for AMCs. Also, with increasing competition, AMCs were forced to pass on a higher share of the TER to distributors.

What has further depressed AUMs in the current year is that debt mutual funds saw a lot of outflows because returns for longer term debt mutual funds were muted because of the rise in interest rates (Rising interest rates cause bond values to fall). There is also significant growth in passive products like Exchange Traded Funds (ETFs) and index funds which typically are low cost products, and thus the yield that an AMC makes on a passive product is significantly lower than active mutual funds. As a result of all these factors, the profit growth for the industry from FY2018 to FY2022 has been slower than the growth in the AUM.

What must be noted here is that the reduction in TER has benefited mutual fund investors through lower pricing. This has made investing through mutual funds a very attractive option for investors and this should spur long term growth in the industry. A sizable Systematic Investment Plan (SIP) book, at Rs 156,000 crore (annual) which is also steadily growing every month further adds to the growth trajectory. While there is a compression in yields for AMCs over the last few years, over the long term, the lower TER should be set off by scale and operating leverage. This is a business where growth in AUM happens just by the growth in the underlying investment over the long term – other levers add to this growth.

Asset Management is a business which generates healthy cashflows and the listed AMCs have also been distributing a significant part of their profits via dividends. As such most of the listed AMCs are trading at attractive dividend yields as also a reasonable Price to Earnings ratios. This is in particular contrast with the high valuation of other high-quality companies with good growth prospects. A great company at a reasonable price is just what we think the doctor ordered.

September 2022: Dollar surges as the US Fed raises interest rates

Last month we spoke about how Jerome Powell, the Chair of the US Fed had indicated at the Jackson Hole Symposium that the Fed remained very concerned about inflation and more importantly inflationary expectations. The Fed raised interest rates by 75 basis points for the third consecutive meeting. As the Fed has raised interest rates to fight inflation over the last several months as also started its Quantitative Tightening (QT) program, there have been several consequences of the same. One, we have seen interest rates harden all across the yield curve in the US and the 10-year US bond yield hit close to 4% recently from its 52 week low of 1.34%. When yields on bonds go up, the price of the bond falls – we have seen severe losses suffered by bond holders in the US and across the globe. The second impact of the fight against inflation is the strengthening of the US dollar across most major currencies.

The rupee too has taken a hit against the dollar – below is a table of how the rupee has appreciated/depreciated against different currencies over the last 12 months with a positive number indicating appreciation and a negative number indicating depreciation.


1Y % USD GBP EURO YEN YUAN
INR -9.3% 13.2% 8.9% 17.2% 0.1%

The RBI has been selling dollars from its forex reserves to stabilize the rupee and India’s forex reserves are down by $91bn over the last 12 months. Looking at the strength of the US dollar over the last 12 months against all major currencies, and the appreciation of the rupee against most currencies other than the dollar, one wonders whether it is wise to fritter away precious foreign exchange trying to defend the rupee against the dollar. When the RBI sells dollars, it is buying rupees – so this foreign exchange intervention by the RBI has also resulted in liquidity tightening in India.

In an environment like this, where central banks around the world are raising interest rates and also reducing their balance sheet through QT, and a consequent flight to the US dollar, it behooves investors to be cautious in their outlook over the short to medium term. What further adds to our caution is that valuations of most high-quality companies in India are elevated. As we said in our newsletter last month, we expect markets to remain volatile over the short term – that said, past experience tells us that such periods of high volatility also throw up good opportunities for the patient investor.

August 2022: Corporate profit growth slows in the June 2022 quarter

The June 2022 quarter results are out and we thought we will review them to gauge the health of the broad corporate sector. We looked at the non-financials in the BSE500, all but 2 of whom have reported results for the June 2022 quarter. The material sector has reported very good growth in earnings because of high international commodity prices – so we looked at the data in aggregate and also looked at the data by excluding the material sector. The tables below summarize the data – we have used 3-year CAGR to eliminate the impact of covid.

BSE500 (Ex-Financials) Sep-21 Dec-21 Mar-22 Jun-22
Revenue (Rs cr) 20,96,165 23,43,635 25,57,167 26,69,986
3 Year Revenue CAGR 6.6% 9.2% 12.2% 15.3%
EBIT (RS cr) 2,55,925 2,75,077 3,03,696 2,53,824
3 Year EBIT CAGR 11.9% 15.8% 14.1% 11.0%
EBIT Margin 12.2% 11.7% 11.9% 9.5%
BSE500 (Ex-Financials, Ex-Material) Sep-21 Dec-21 Mar-22 Jun-22
3 Year Revenue CAGR 5.5% 8.2% 11.2% 14.5%
3 Year EBIT CAGR 7.9% 13.3% 10.5% 6.2%
EBIT Margin 10.7% 10.6% 10.7% 8.3%

While revenue growth remains strong and has been showing an upward trend over the last few quarters, EBIT growth which was showing a healthy uptrend till March 2022, has declined to 11.0% in the June quarter. If we exclude the Material sector from the calculations, revenue growth remains strong, but EBIT is growing at a 3-year CAGR of only 6.2%. It looks like high commodity prices and inflation are having an impact on the EBIT growth, possibly because businesses are yet to pass on the input cost pressure to customers. EBIT growth peaked in Dec-21 and has been on a slight declining trend both for the aggregate data and for the data, ex-Material. EBIT margins too have declined significantly in the June 2022 quarter.

August 2022 was a good month for Indian equities and the Nifty was up 3.5% for the month. One of the reasons for the large up-move in stocks globally over the last two and a half months has been the cool off in commodities and a downtick in recorded inflation, something we spoke about in our June newsletter. The Nifty has rallied 17% from its low made roughly two and a half months ago and is now 4.5% away from an All-time high.

One of the reasons that the market rallied was that the Fed was expected to pivot, to easing off on interest rate increases as inflation cools down. However, at the Jackson Hole Symposium, Jerome Powell, the head of the US Fed, signaled that the US Fed remains very concerned about inflation and more importantly, inflationary expectations (which can spiral as seen in the past) and is likely to continue to raise interest rates to tame inflation. It should also be noted that the rally in stocks was in response to the US inflation falling from 9.1% to

8.5% but this is a long way away from the US Fed target of 2% inflation. The US Fed seems determined to bring inflation down to 2% and the language of Jerome Powell at Jackson Hole suggests that high inflationary expectations are a greater risk than a potential recession considering that the jobs market remains strong so far. The Quantitative Tightening of the US Fed is also expected to double starting 1st September, 2022.

As such, we expect a volatile period for markets going forward. That said, we as a principle, do not try to predict economic events because it is really so hard to do – there are so many moving parts and anything can switch at any point in time and make your economic analysis worthless. We remain focused on searching for high quality companies trading at reasonable valuations and keep a long -term view to ride out economic events. We must admit though that at a recent review we found that there are very few additional opportunities in our high-quality universe which offer a good reward to risk ratio. Valuations of high-quality companies are elevated and investors would be well advised to keep this in mind.

July 2022: Valuations at point of entry determine subsequent returns

We believe that there are two important factors which can help an investor make superior returns in equities over the long term – 1) Buying a high-quality business and 2) Buying it at a reasonable price. A high-quality business, according to us, is one which is highly profitable (as measured by return on equity), generates free cash flow, has a competitive edge (or moat) and has good corporate governance.

While undoubtedly, the quality of the business and its growth has a very large bearing on the returns that one can get from that business over the long term, ignoring the valuation at which the company is bought can lead to disastrous performance even over the long term. Take the example of Infosys which at the peak in 2000, traded at 320x FY2000 earnings. Subsequently over the next decade Infosys delivered a 10-year earnings CAGR (compound annual growth rate) of 35% per annum – but the stock delivered near zero returns from the peak price in 2000 to 2010, because the initial valuation was too high. The price one pays at the time of purchase has a large bearing on the returns that one can hope to make in a high-quality business.

There are different approaches one can take with respect to the valuation of a company. One approach is to look at absolute value – i.e. an absolutely low price to earnings ratio or a high dividend yield (comparable to 10-year bond yields), or market capitalisation less than the net current assets on the balance sheet. While this can be useful to determine a low valuation level, this is also fraught with risk, because many of the companies that trade at a very low absolute value may have a broken business model or poor corporate governance. Another approach is to look at relative valuation – i.e. a comparison of the valuation of a company with other companies in the same sector – this can help identify an undervalued company with respect to its peers. Yet another approach is to look at private market value – what is the value that a strategic buyer (an acquirer of a part stake or the whole company) places on a company. Usually the private market value is towards the top end of the valuation zone. Yet another approach is to compare the current valuation of a company with its historical valuation to determine whether the current valuation is low or high with respect to its history. We use a combination of these different approaches to figure out whether a company is undervalued or overvalued at the current market price.

One must however keep in mind, while trying to buy a company at a low valuation, that when a stock is trading at a low valuation, there is usually a reason for it – either the whole market is down, or the sector in which the company is in, is facing some headwinds, or there could be some specific issue with the company itself. It is then up to the investor to determine whether this problem is temporary in nature or whether there is a permanent damage to the business model of the company. Only when one is satisfied that the problem is temporary in nature, can one proceed to purchase the stock.

While undertaking this exercise, one must pay heed to Warren Buffett’s words “It’s far better to buy a wonderful company at a fair price than a fair company at a wonderful price”. Investors must spend a fair bit of their time looking for wonderful companies and try to pay a reasonable price for them. Over the last few years, valuations of high-quality companies have been bid up aggressively and are trading at high valuations and this is something that investors need to watch out for.

June 2022: Commodities cool off

The Nifty fell violently during June 2022, and was at one point down 8% for the month but recovered a little towards the end of the month to close down 4.8%. The markets have been volatile over the last 7-8 months, falling sharply at times, coupled with swift recoveries with the overall direction downwards. Perhaps the factor playing up the most on market participants’ minds is the issue of inflation globally. While there are many factors affecting inflation such as supply bottlenecks linked to lingering effects of covid and wage inflation, one of the factors has been the large run up in commodity prices and we spoke about this in our March newsletter.

Over the last few months there has been a correction in commodity prices – the below table shows the price change from 4 reference points:

Commodity price change Unit Fall from 52-week high 1 Month Change YTD Change (6 months) 1 Yr Change
Brent Crude USD/Barrel -16.9% -5.9% 48.2% 53.9%
Gold USD/Ounce -12.6% -1.5% -0.9% 2.2%
Aluminium USD/MT -38.5% -11.2% -13.4% -2.4%
Copper USD/MT -21.7% -11.1% -13.6% -10.2%
Cotton USD/lb -27.0% -20.2% -13.2% 15.1%
Sugar USD/lb -9.8% -3.8% -0.8% 5.9%
Wheat USD/Bushel -32.2% -16.4% 17.9% 35.3%
Steel (Hot Rolled Coil) USD/Tonne -51.2% -20.2% -33.6% -47.5%

Industrial and agricultural commodities have had a steep fall from their 52-week highs, over the last few months – oil is one of the commodities which stands out as not having had such a steep fall, perhaps because of the continuing war in Ukraine and the sanctions on Russia. Even on a 12-month basis the price rise in commodities which was looking large till a few months back, is relatively contained with the exception of crude and wheat which are impacted by the war in Ukraine.

Much of this price damage in commodities has happened over the last month or so and one wonders whether this is the impact of the US Fed action, specifically the Quantitative Tightening (QT) which started from 1-Jun-2022. The US Fed has started reducing the size of its balance sheet by $47.5bn per month starting 1-Jun-22 and this is scheduled to go up to $95bn per month from 1-Sep- 2022. This is likely affecting commodity prices too. Another factor affecting commodity prices is that the R word is suddenly the top news among analysts and observers with many such expecting a recession in the US in the not too distant future as the US Fed tightens monetary policy to fight inflation, which is at a 40-year high.

As the global economy slows due to monetary tightening and reduction of covid related fiscal stimulus and as supply chains slowly resolve themselves, inflation may slowly head downwards through the year. Inflation is one of the top concerns of the market over the last several months and while it may still be early to call this, any respite on this front should be welcome news for investors.

May 2022: Inflation – a headwind for corporate profits and markets

As is customary for us, we decided to review the quarterly results for the non-financials in the BSE500 for the quarter ended 31-Mar-22 to get an idea of how corporate results are shaping up. Below are the headline numbers:

BSE500 (Non – financials) Sep-21 Dec-21 Mar-22
YoY Revenue Growth 33.0% 28.2% 24.0%
YoY EBIT Growth 28.2% 19.3% 15.5%
EBIT Margin 12.4% 12.1% 12.3%
Excluding Energy & Materials Sep-21 Dec-21 Mar-22
YoY Revenue Growth 25.0% 19.7% 17.0%
YoY EBIT Growth 17.0% 7.1% 5.8%
EBIT Margin 12.6% 13.0% 12.5%

While aggregate revenue growth continues to be healthy, operating profit growth is lower. High commodity prices have boosted the profits of the material and energy sectors. If we exclude the material and energy sector from the calculations, revenue growth drops from 24.0% to 17.0% and operating profit (EBIT) growth drops from 15.5% to 5.8%. Clearly, the high commodity prices have dented the operating margins of the non-commodity sectors. So, while corporate revenues have been healthy, high commodity price inflation is eating into the margins of corporates and it remains to be seen whether high inflation will begin to impact economic growth at the margin, going forward.

The markets continued their fall during the month of May and at one point the Nifty 50 was down 8% for the month – a relief rally since then, has meant that the Nifty is down a little less severe 3% for the month. Markets globally have tumbled – the Nasdaq100 is down 24.4% from its All Time High, the S&P500 is down 13.7%, Nifty is down 10.9% and the BSE500 is down 11.6%. The median stock in the S&P500 is down 22.8% and in the BSE500 is down 33.9% from its All Time High. The below table shows the drawdown from the All Time High for the BSE500, S&P500 and Nasdaq100 constituents. As can be seen from the table, 38% of the BSE500 and 35% of the Nasdaq100 are down more than 40% from their All Time Highs.

Down between % of stocks down from all time high
BSE 500 S&P 500 NASDAQ 100
80% – 100% 6% 1% 2%
60% – 80% 10% 6% 12%
40% – 60% 22% 14% 21%
20% – 40% 41% 37% 33%
10% – 20% 16% 23% 22%
Below 10% 6% 19% 11%
Total 100% 100% 100%

What seems to have spooked markets globally is persistent inflation – US inflation for April 2022 came in at 8.3% which although lower than the 8.5% recorded for March 2022, is way beyond the 2% target of the US Fed. The minutes of the latest meeting of the US Fed suggest that the Fed participants expect 50 basis points interest rate increases at the next couple of meetings in an effort to bring inflation under control. It appears that the Fed may keep hiking interest rates until it sees a significant fall in inflation. The Fed also laid out a plan whereby it would reduce its more than $8 trillion balance sheet – at a rate which will go up to $95 bn per month from August 2022. This is a significant change – whereas several months back the Fed was providing liquidity of almost a trillion dollars per year, it will start reducing liquidity at the rate of a trillion dollars per year.

Markets have been buoyed over the last 2 years because of ultra-low interest rates and a huge infusion of liquidity by all the major central bankers globally to combat covid. With the huge jump in inflation globally, that era seems to have come to an end as central bankers raise interest rates and reduce balance sheet size to combat the beast. The continuing war in Ukraine has boosted the price of crude oil and other commodities and India as a large net importer of oil and other commodities, will be impacted. In an environment like this, protecting capital over the long term is of paramount importance and we take comfort in the fact that we own high quality companies that have stood the test of time and most of them are trading at prices that are very reasonable in relation to their long-term prospects. We have reduced or exited stocks in our portfolio which had become expensive and thus reduced the risk in the portfolio. We also have a small amount of cash in our portfolios which we can deploy if we get good opportunities.