December 2023: HDFC Bank- when elephants dance

HDFC Bank has been a large holding for us for a while and after the merger of HDFC Ltd with it, the position size has become even larger. Given its underperformance over the last 3 years, we felt that this is a good opportunity to discuss why we own HDFC Bank and why we have such a large weight in it. The weight that we would like to have in any stock in our portfolio depends on two factors – 1) How strong is the company’s competitive edge and the length of time that it can last and 2) How high is the sustainable growth rate of the company? HDFC Bank scores well on both parameters. The biggest source of competitive edge for HDFC Bank in a competitive banking industry is also two-fold: a) low cost of funds through current and savings bank account (CASA) deposits and b) Credit discipline.

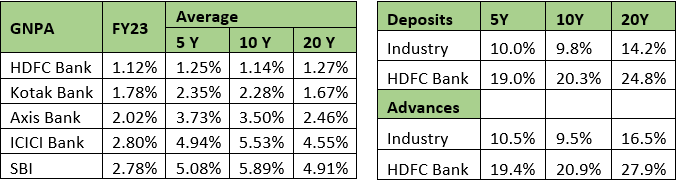
In an environment where the banking industry has grown its deposits at 9.8% pa over the last 10 years (using March 2023 numbers because it is pre-merger), HDFC Bank has grown its deposits at 20.3% per annum. CASA forms the bulk of the low-cost funds that a bank can access. HDFC Bank’s CASA deposits have grown at 19.5% for 10 years and 25.0% for 20 years, far outstripping the growth in deposits for the industry of 12.4% and 15.3% respectively. The liability franchise of HDFC Bank in the form of its extensive branch network is extremely important to its long-term competitive edge.

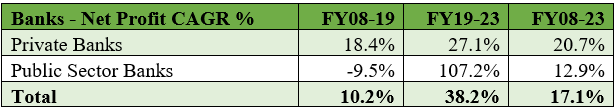
HDFC Bank is very well regarded for its credit discipline in the industry. It has the lowest Gross NPAs (nonperforming assets) in the industry over the last 20 years. From FY2016 to FY2018, the banking industry went through an upheaval as the RBI’s Asset Quality Review forced many banks to recognize their unrecognized NPAs and many of these went through the resolution process in NCLT courts under the Insolvency and Bankruptcy Code. It is interesting to note that HDFC Bank did not have even one large case in NCLT. This is testimony to its remarkable credit discipline which is embedded into the HDFC Bank culture.

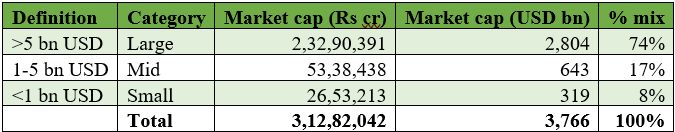
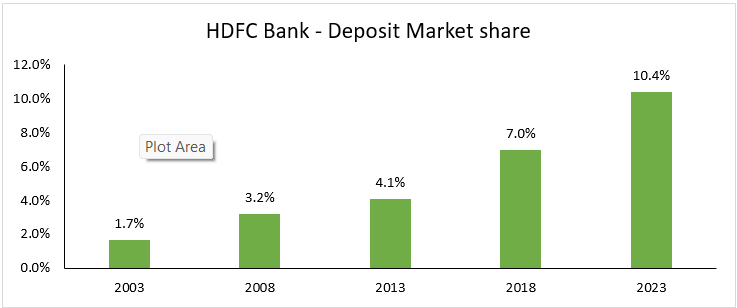
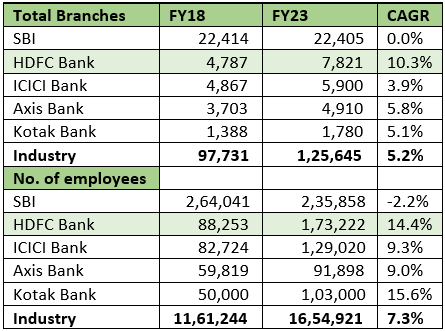
The second criterion for us to have a large weight in HDFC Bank is that it has a large runway of growth. Some people have questioned whether HDFC Bank can continue to grow at a fast pace after having achieved its large size. However, it is our assessment that with PSU banks still forming 66% of total deposits and 64% of CASA deposits, there is still room for private banks (including HDFC Bank) to increase their market share over time. HDFC Bank has relentlessly increased its market share over time and we expect the trend to continue. We prefer using market share of deposits, rather than of advances, because deposits drive loans in a bank on a sustainable basis.


Further, HDFC Bank has been aggressively expanding its branches over the last 5 years to further strengthen its liability franchise. What this means, is that HDFC Bank has been upfronting investments in its business, in order to prepare for the next leg of growth. It is not too far-fetched to think that HDFC Bank can at some point, become as large as SBI, and it seems to be preparing for that with its branch expansion.

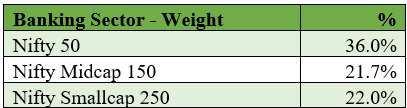
So, while the case for HDFC Bank is as strong as ever (HDFC Bank has seen stock price appreciation of 22.2% pa over the last 20 years and 18.6% pa for the last 10 years), there have been some apprehensions expressed by analysts. The first relates to the drag on its growth because of the merger. However, we believe, historically, HDFC Bank was at a disadvantage as it did not own a home loan customer compared to peer banks. One should note, home loan is a long duration product, and the lifetime value of a home loan customer is immense, and the bank has great cross-selling opportunities for both deposits and loans. With public sector banks still having 66% market share and HDFC Bank expanding it reach through branch expansion, it will continue to gain market share and grow at a faster rate compared to the industry. In addition, the banking sector itself is expected to grow at or above nominal GDP growth.

The second apprehension relates to inheritance of HDFC Limited’s NPAs in the wholesale book which came in as a bit of a surprise. However, when we look at the overall NPAs for the combined entity they continue to be reasonably low, and hence in the overall scheme of things both credit quality and profitability continue to be strong and best in class.

With the merger, HDFC Bank also becomes the ultimate parent to all the subsidiaries of HDFC Limited i.e. life insurance, general insurance, and asset management etc. From being a group company to ultimate parent, the relationship with them will improve with better focus and engagement. Perhaps this will result in higher growth and profitability in the subsidiaries and lead to better value for HDFC Bank as well.

The third apprehension was related to a technical factor i.e. the uncertainty about the weight of the combined entity in the global indices. HDFC Bank has historically had a large proportion of its shareholding held by FPIs (Foreign Portfolio Investors). Since there is a restriction on FPIs to own only 74% in an Indian bank, the large FPI holding in HDFC Bank reduces the headroom for an FPI to own HDFC Bank and that reduces the weight indices providers like MSCI would give to HDFC Bank. While this technical problem has been there with HDFC Bank for several years, the merger further brought this into focus and MSCI has currently allocated only half the weight to HDFC Bank as it would normally deserve, based on its free float market capitalization. Further, mutual funds in India are only permitted to buy a maximum of 10% in a particular stock. Since HDFC Bank now has a 13.5% weight in the Nifty50 and an 8.4% weight in the Nifty500, many mutual funds have been forced to reduce their weight in HDFC Bank. At the minimum, this does not allow them to own HDFC Bank, in line with its representation in the indices.

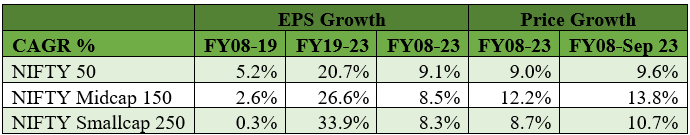
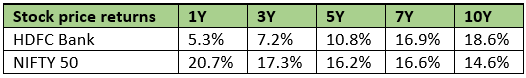
For us, as long-term investors, these technical factors, though a good explainer of short-term market returns, are not a consideration from the long-term point of view. We believe that eventually stocks are slaves of earnings and it is hard to ignore a business, growing at a strong 18-20% pa, despite whatever technical factors may be impeding it. The table below shows the performance of HDFC Bank against the Nifty over the years. One of the reasons for poor 3 and 5-year performance is that valuations 3 and 5 years ago were on the higher side, but valuations are lower now. Please note that despite recent underperformance, over a 10-year basis, HDFC Bank continues to outperform the Nifty because of its superior earnings growth.

Due to its underperformance over the last several years, HDFC Bank now trades at the bottom end of our valuation band. This is particularly so, as we are at the end of December and now rolling over our valuation bands to the next year. As per consensus analyst estimates, HDFC Bank is expected to report 18-20% over the next 2-3 years, in line with its 10-year history. In a market where it is very hard to find an attractive business trading at a reasonable price, HDFC Bank looks like a mouth- watering opportunity to us. We use such words sparingly (have used it only once before in our newsletters over the last 18 odd years) and we remain confident that HDFC Bank will deliver good returns to shareholders over the foreseeable future.

November 2023: Corporate growth over the medium and long term

Charlie Munger, a doyen of value investing, passed away on 28th November, just a month or so short of completing 100 years on this planet. It is hard for us to express in words, the loss we feel, on hearing the news because Charlie was a guru to us and an inspiration, and we learned so much from him – not only how to invest, but also how to think. Charlie, you will be deeply missed! One of Charlie’s quotes which made a deep impact on us:

“Spend each day trying to be a little wiser than you were when you woke up. Day by day, and at the end of the day if you live long enough, like most people, you will get out of life what you deserve.”

Now, on to more mundane things – which is, how corporates in India have been performing in the more recent past and how does it stack up over a longer period. We looked as usual, at the non-financials in the BSE500 most of whom have reported for the September quarter. While revenues are flat yoy, EBIT is up strongly at 57.5%. The energy sector, has seen its profits more than triple on a yoy basis. Excluding that too, the revenue growth is 4.2% and the EBIT growth is 30.7%. Over a 4-year period, revenues are up 12.5% and EBIT growth is 19.9%. Excluding the energy sector, the EBIT 4 -year CAGR is still a very healthy 16.8%.

EBIT has improved remarkably over the last 4 years as corporates have managed to pass on the cost increases to their customers. How does the longer term (10 and 20 year) picture look? We decided to look at the earnings per share (EPS) data that the BSE releases daily for the Sensex and the BSE500. We must add a caveat here that the constituents of an index keep changing over time – often stocks come in to the index after they have done well for a period, and stocks go out when they have done badly for some time. This may distort some values when estimating long term earnings growth for the corporate sector, but mostly these changes happen only to the marginal stocks in the index.

For the BSE Sensex, its reported EPS has grown at 9.1% over the last 10 years. When we look at the BSE500, its EPS has grown at 8.9% over the same period. Over a 20-year period, the Sensex EPS has grown at a higher 11.6%. We have to keep in mind here that there is a link between nominal GDP growth and earnings growth for corporates and historically they have been closely aligned. Since nominal GDP growth consists of real growth plus inflation, this reporting would not be complete without adding the inflation numbers during this period. The cumulative CPI inflation over the last 10 years (Sep 2023 is the end date) is 4.9% per annum while CPI inflation over the 20-year period is 6.6% per annum. For the inflation calculation, we have used 2 datasets. Data from 2003 – 2011 has been sourced from the Labor Bureau, Govt. of India, which publishes CPI for Industrial workers. Data from 2012 to 2023 has been sourced from CPI numbers released by the Ministry of Statistics and Program Implementation. We have done this in order to have meaningful longer-term data.

What one can conclude from this data is that the last 10 years has seen slower earnings growth than the past and while some is due to lower inflation, some of it is due to slower economic growth. Reasons one can think of, for lower growth in the last 10 years, is some unexpected events like demonetisation, the ILFS crisis and the covid lockdowns. However, the last 10 years also saw some significant reforms like GST, Insolvency and Bankruptcy Code (IBC) and RERA. We also saw a clean-up of the banking sector, which allows banks to adequately fund the future growth of the economy. We therefore expect future economic and corporate growth to revert to the mean and grow at a faster pace than it has done over the last 10 years.

While the EPS growth for the Sensex is 9.1%, the price growth for the index is 12.4% per annum over the last 10 years. The PE of the Sensex was 17.6 ten years ago and it is now 23.7. Over the last 30 years the Sensex has traded between 16.2x and 23.6x earnings at the median of the lows and the highs. So, over the last 10 years, price growth has outstripped earnings growth as the Sensex has moved from the lower end of the valuation range to the higher end of the range. It is likely that much of the rerating of the Indian markets is over and future growth in the index will be more linked to the earnings growth reported in the future.

October 2023: Margin of Safety – central to investing

Margin of Safety is at the centre of how we invest for our clients. “When you build a bridge, you insist it carry 30,000 pounds, but you only drive 10,000 pound trucks across it. And that same principle works in investing.” – Warren Buffett.

Margin of safety involves purchasing a security when its market price is substantially below its intrinsic value. That brings us to the question of ‘What is intrinsic value?’. Intrinsic value can be defined as the sum total of all the free cash flows that accrue to a company upto infinity, discounted to today at an appropriate discount rate. We have defined these terms in prior newsletters – so we will not dwell on their meaning here. Just as important as the quantum of free cash flows, is the certainty of receiving them.

Margin of safety, in some sense, means being conservative about the assumptions that you build into the buy case for any particular security. It means not building rosy projections about the future to justify a current price which may often be too high.

Margin of safety extends, for us, to the quality of businesses that we invest in. A poor-quality business, no matter how attractively priced, can be a minefield sometimes. Firstly, time is the enemy of the poor-quality business while it is a friend of the good quality business. With passing time, the poor-quality business will deteriorate in value and even if you are able to generate a satisfactory return over the long term, the time period it takes for the market to appreciate such a business, can be awfully long and can test your patience and the eventual return. In the current environment, of course, a number of businesses, particularly small caps, whether of mediocre quality or exceptional quality, have been bid up considerably but such periods do not last indefinitely as reality will, sooner or later, catch up with prices.

Our investment philosophy rests on risk minimization rather than return maximization. It’s a different matter that we have performed reasonably well over time, but our attitude to investing is that of safety first. We have reiterated in many of our conversations with you that protection of capital is our Goal No 1 and we take this very seriously. Sometimes, you may find that we are somewhat underperforming the market during strong bull markets, where the margin of safety has diminished in the market place. Our real value to our clients becomes more obvious over a full cycle of the market and our historical track record is testimony to that. We have had only 2 negative performance financial years (April to March) in our history when the Nifty has had 4 such years. Even the quantum of fall, in the negative years, has been less than the Nifty. The way arithmetic works is, that if you fall less, then even when you grow slightly less in subsequent years, you come out better. This strategy of risk minimization helps our clients sleep better and stay through the course of volatility in markets and enjoy the benefit of long term growth in their portfolio.

We believe that there is less margin of safety in the current environment and we have over time, shepherded our portfolio into the safer end of our investment universe, based on the risk reward that the different stocks provide us.

September 2023: Mid-caps and small caps are quite the rage in Indian markets

We want to spend some time talking about mid-caps and small-caps because they have lately been the rage in Indian markets. Domestic money has poured into mid-cap and small-cap mutual funds, which has in turn fed into the prices of these stocks. The Nifty Midcap 150 Index is up 33.4% and the Nifty Smallcap 250 Index is up 39.2% over the last 6 months. The Nifty50 index is up 13.1% over the same period.

First, we have a look at the domestic money that has poured into small-cap and mid-cap funds. For the financial year to date up to August 2023, as much as 53.8% of the total inflows into domestic equity mutual funds flowed into mid-cap and small-cap funds.

When we look at the size of the total assets deployed in small-cap and mid-cap schemes of mutual funds, we find that the assets under management (AUM) of the small-cap and mid-cap funds are now almost as large as large-cap funds.

However, when we see the market cap that large caps, mid-caps, and small-caps represent, it tells a very different story – about 74% of the market cap of India is with large caps, and mid-caps and small caps form a much smaller part of the total market capitalization of the country. Therefore, the large appreciation in mid-caps and small caps is not a surprise.

Now, we have a look at the earnings picture for the different indices – the Nifty50 which represents large caps, the Nifty Midcap 150 index, and the Nifty Smallcap 250 indices for mid-caps and small caps respectively.

While viewing this data above, we must keep in mind that FY2008 was the peak of the prior cycle. The Nifty EPS grew at 22.4% pa from FY2003 to FY2008. Unfortunately, the data for the Nifty Midcap150 and the Nifty Smallcap250 is not available prior to 2007, and that limits this data to some extent, because the comparison is from the peak of the prior economic cycle.

When one looks at the EPS growth for the entire period, we find that it matches somewhat closely with the market performance of the different indices up to FY2023. What one observes is that FY2008 to FY2019 was a lean period of EPS growth for the indices and from FY2019 to FY2023 has been a period of accelerated growth. A large reason for this is the profitability of the banking sector which constitutes a large proportion of the total weight in the indices.

(Source – NSE, As on 30th Sep, 2023)

From FY2008 to FY2019 the banking sector recorded relatively muted growth in earnings at 10.2% pa. This is largely because while the private sector banks reported a healthy 18.4% pa growth, the profits of the public sector banks de-grew at 9.5% pa over this period. This was a result of the banks being forced to recognize NPAs of the past, which depressed earnings for FY2019. From FY2019 to FY2023, there has been a very strong growth in profits for banks, particularly PSU banks. However, over the entire period FY2008 to FY2023, private banks have continued to outpace PSU banks.

While the performance of the different indices matches closely with earnings growth for the period FY2008 to FY2023, when we include the strong performance of the mid-caps and the small caps over the last 6 months, we find that the performance now looks stretched. As such, we believe that investors should carefully monitor their mid-cap and small-cap holdings for any exuberance in their valuations. We too have been slowly reducing some of our weights in some of our mid and small-cap stocks as they have become more expensive.

August 2023: A look at the June 2023 corporate results

After a strong showing, in the first 4 months of the financial year, the market consolidated in the month of August, and was down 2.5% for the month. Since most of the results for the June 2023 quarter are out, we thought we will review them to gauge corporate India’s progress.

Corporate results for the June 2023 quarter are moderately good on the revenues front and quite strong on the operating profit (EBIT) front. We looked at the BSE500 ex-financials and found that while revenues were up 3.0% for Jun 2023, operating profits (EBIT) were up a strong 32.3%. However, two sectors, Material and Energy have some extra-ordinary factors which are driving the EBIT of the material sector down significantly year over year (yoy) while the oil PSUs have seen their profits grow significantly yoy because of government policy. If we exclude these 2 sectors from the calculations, revenues are up 12.7% and the EBIT is up a strong 26.0%. Two companies have had a very large delta in their profits for the yoy comparison – Tata Motors and Interglobe Aviation (Indigo Airlines). Even if we were to exclude these 2 companies, the EBIT growth is a very healthy 16.4%.

When we look at the 5 year growth picture for these companies, we find that total revenues are up 11.4% per annum while the EBIT is up 12.3%. This is in the same ball park as the long term corporate growth in India. It appears that we are limping back to normal, post-pandemic.

One problem confronting the global markets, particularly US and Europe, is the ratchet up in interest rates over the last 17 months. This poses a two-fold problem for markets. First, there is the drag of interest rates on demand for goods that are financed by borrowing such as housing, consumer durables, cars and credit card spending. The second, is the impact it has on valuations of stocks. We must remember that the intrinsic value of a stock is the sum total of all the free cash flows into eternity, discounted to today. When you discount future cash flows back to today, you need to use a discount rate, which is closely linked to the interest rates prevailing in the economy. As such, high interest rates should theoretically cause valuations to soften, particularly in comparison with a time when interest rates were close to zero or even negative.

In India, however, despite some shocks, inflation has not been as out of whack from historical ranges as it has been in the West. As a result, the long-term bond yields in India are lower than medium term and long-term history.

The 10 year Indian government bond yield at 7.2% now, is lower than the rate pre-covid, and generally below peaks observed historically. This suggests that the inflation problem in India is not as acute as it is in the West and therefore the impact on bond prices is not as severe, as in the West where, for example, the US 10 year bond has lost 17.6% in value over the last 2 years.

However, the Indian market does trade at high valuations and the Nifty and the Sensex are trading at valuations which are close to the top end of the historical range. The corporate sector will need to continue to report high growth rates to justify these high valuations. We have been staying clear of the highly valued stocks in the market and have over time, reduced our weightage to expensive stocks in our portfolio. This is a continuous exercise for us – to sell expensive stocks in the portfolio and to redeploy in stocks that are trading at reasonable valuations and we intend to continue doing that in the future as well.

July 2023: Will the US economy have a soft landing?

The last few years have seen some extraordinary monetary policy action by central bankers all over the world. First, there was the “open the spigots” mode due to the economic shock of the covid pandemic. The Fed funds rate came down from 1.5% – 1.75% in Dec 2019 to 0% -0.25% in Mar 2020 and the Fed also launched a massive Quantitative Easing (QE) program. The QE resulted in the Fed buying bonds worth about $4.8 trillion as the Fed’s balance sheet expanded from $4.2 trillion in Dec 2019 to nearly $9 trillion at its peak in April 2022.

With the emergence of omicron as a less deadly variant, we eventually ended up with some sort of herd immunity and we hope we can say that we have seen the back of covid. However, as the economy returned to its more normal trajectory and because of some supply bottlenecks that persisted for some time, there was a burst of inflation from April 2021 onwards and the inflation rate in the US peaked at 9.1% in June 2022. It continued to stay elevated through the rest of 2022. What also contributed to the inflation was the Ukraine war and the resultant increase in commodity prices.

After saying initially that inflation was transitory, the US Fed launched a massive monetary tightening program starting March 2022 and over the last16 months, has increased interest rates by 5.25% to combat high inflation. The Fed funds rate is now at its highest point since 2001. Inflation has been cooling over the last several months and CPI inflation came down to 3% in June 2023, although the core inflation number was at 4.8%. What we must remember also is that the 3% inflation print is on a base of June 2022 when the inflation rate was 9.1%. Inflation in June 2021 was 5.4% – so in effect over 3 years, there has been an 18.4% increase in the price level for the average consumer. The total increase in core inflation from June 2020 to June 2023 is 16.0%. This lifts the price level higher on a permanent basis because the Fed is trying to bring inflation down to 2% – it’s not talking of negative inflation. This roughly 16-18% inflation over 3 years could have some impact on the consumption and savings behavior of Americans.

The S&P500 which had fallen from a high of 4819 in January, 2022 to a low of 3492 in October 2022, (a fall of 27.5%) has rebounded subsequently to 4582 and is now only about 5% away from its high in January 2022. What seems to be driving the market upwards is the expectation that there will be some sort of “soft landing” for the US economy. Most economists were expecting a recession in the US until not too long ago but now many are changing their tune to a “soft landing” scenario.

The reason for the optimism is that the jobs data has held up well. If we look at the graph below of the unemployment rate of the US since 1948, we find that the unemployment rate was at its lowest point for about 5 decades in April 2023 at 3.4% and has edged up to 3.6% in June 2023. Pre-pandemic too, the unemployment rate was about 3.5%. So, we are looking at historically low unemployment here, even after a 5.25% increase in the Fed funds rate over 16 months. While monetary policy tightening works with a lag, it is still remarkable how strong the jobs data is.

While talking of record low unemployment rate, we have to bear in mind that the labour force participation rate in 2023 is a lot lower than it was in 2000, as we can see from the graph below:

While the employment data continues to be robust, the economy will have to deal with the impact of sharply higher interest rates, tightening of lending conditions because of regional bank failures and a collapse in commercial real estate prices. The big question in everyone’s minds at the moment is whether the US economy will have a soft landing or will it go into a recession in the quarters ahead. The jury is still out on this one and it’s very hard to say which way the cookie will crumble. In the meanwhile, US GDP growth for the June 2023 quarter came in at 2.4%, against an expected 1.8%, which should give some hope to the “soft landing” thesis. You may be wondering – What does this have to do with me as an investor in Indian equities? Well, as the old adage goes – “When the US sneezes, the world catches a cold”.

June 2023: Nifty at an All Time High

June 2023 ended with the market at an all-time high, on a weekly and monthly basis. All-time highs are considered significant events by technical analysts because they can potentially signal a blue skies scenario. We must add here, that in some cases, if the technical break out turns out to be false, they can also become significant tops.

In our last month’s newsletter, we noted that economic growth in the last 4 years has been slow, largely because of the pandemic and the strict lockdowns. For the BSE500 non-financials, although the aggregate EBIT showed a decline for FY2023, when looked at, ex of the material sector, the EBIT growth is 7.9%. For the 4-year period from FY2019 to FY2023, the EBIT growth is 8.8% per annum, reasonable given the circumstances, but below trend.

The recovery seen by India is a K shaped one, wherein the poor have seen their incomes lag, while the upper middle class and the rich have seen their incomes and spending expand. So, while metrics that correspond to usage of products and services by the poor, continue to be poor, other indicators of the economy like GST collections are maintaining a 12% growth trajectory. Some of the higher GST growth may also be due to better tax compliance.

It appears now that we have seen the back of covid and the movement of life, the world over, to normalcy is welcome. Economic growth rates which have been poor over the last 4 years, will hopefully move back to a higher trajectory, helped by reforms like GST, IBC and RERA. The cleanup of the NPAs in the banking sector also means that the corporate sector and the banking sector are healthier than before, and banks have adequate liquidity to lend, for the expected growth. Current estimates suggest about 6% real GDP growth for the year which is reasonably good. We expect growth rates to be in the 5-7% range over the medium term and our expectation is based on India’s low GDP per capita and the ability of Indians to provide goods and services to the developed world, given the connected world we live in. Covid provided an impetus to the exports of services perhaps as we all became comfortable with doing meetings, yoga sessions, etc online.

What is also helping India at the moment, is the West’s desire to diversify from their reliance on China as the sole supplier to large parts of their supply chain. This China plus, is an opportunity that is available to many countries and India is one of the countries which has a large opportunity. A lot will depend on the experiments that have started under the PLI program and the thing to watch would be the localisation of content over time.

While growth that one foresees over the medium term is reasonably good, what about the price that we are paying? When we look at the BSE Sensex, it is trading near the top end of its historical valuation band. So, there is not much room for comfort there and growth will need to kick in, to justify the valuation of the indices. For our portfolio we continuously undertake a process of downsizing positions which become expensive on their historical valuation bands and look to invest the proceeds of sale, back into other stocks where we feel we can get a good reward to risk ratio. As such, we do not see significant risk to our portfolio, should high valuations of the Nifty lead to a correction in prices. For our new accounts, we have been slowly scaling up our equity exposure as we see individual opportunities in the market.

May 2023: Growth has slowed over the last 4 years

As we are almost done with the corporate results season for the last quarter of the financial year (FY) March 2023, we thought we would have a look at it. If we go back in history, the omicron variant first emerged in India around December 2021 and as it spread, it became the natural vaccine for the populace. It was relatively less virulent and its spread offered herd immunity to the populace at large. So, FY2023 is the first financial year where covid was largely absent and a comparison of these results with FY2019, a pre covid year could be interesting.

As usual, we looked at the non-financials segment of the BSE500 to gauge corporate performance. 405 out of the 433 non-financial companies in the BSE500 have reported results so far and they represent ~97% of the market cap of the BSE500 (non-financial).

The first thing we notice is that despite strong revenue growth, EBIT growth YoY for the sample set is negative. The material sector (mineral & mining, steel, chemicals, sugar, etc.) is a large contributor to the negative growth, and ex-material, the EBIT growth is a more reasonable 7.9% YoY. EBIT grew very strongly in FY2022 at 34.5% YoY aided by the material sector, and ex-material, the growth rate was still strong at 23.5% YoY.

Then we look at the 4-year picture to get a view of pre-covid to now – Total revenue growth is 12.2% and EBIT growth is 8.8%. EBIT growth, though muted compared to history, is perhaps understandable considering the ramifications of covid and the strict lockdowns.

Now we turn our attention to the GDP data which got released today. Real GDP growth for the quarter Q4 came in at 6.1% and for the year FY23 at 7.2%. While the GDP growth for FY2023 appears reasonably strong, there is a base effect at play here. In FY2022 the first quarter saw the impact of the second wave of covid and in FY2021 we had the first wave of covid. Hence the base effect distorts the image. When we look at the 4-year CAGR of real GDP growth, to eliminate the base effect, the number is 3.4% for real GDP growth and the nominal GDP has a CAGR of 9.6%.

Growth has been slow over the last 4 years compared to history, both for GDP as well as for corporate profits. The pandemic and the resultant lockdown have impacted the economy, which is visible in the numbers. With the pandemic now out of the way, a large clean-up of the corporate sector through the Insolvency and Bankruptcy Code, and a number of reforms like GST and RERA implemented, one can perhaps look forward to better GDP growth and corporate growth in the years ahead.