
October 2026: Quality may make a comeback
As we pen our thoughts at this important juncture in the market, there are many thoughts swirling in our minds – so what you are getting here is probably our longest newsletter to date. So, grab a cup of coffee because this may take some time to read and we hope that it will be well worth your time. There are three thoughts which occupy our mind today – 1) the results that corporate India is reporting 2) the large selling by FIIs over the last 2 years and 3) the AI trade, which has occupied the minds of almost every investor over the last few years.
We had reported in our August 2026 newsletter that both the revenue and EBIT growth for June 2026 for the BSE-500 ex financials ex energy was 20%. We report ex the financials because financials are inherently not comparable with non-financials because there is no EBIT in financials for instance and also non-financials provide a better, more comparable picture of the corporate sector at large. We report ex energy because it tends to be very volatile depending on oil prices and the extent to which the government allows them to pass on the price increases through various measures. Now 20% growth is a very high number, and it continues on two prior quarters of double-digit growth. The early indications we have for September quarter results suggest that the growth momentum is continuing. We will discuss that in detail next month when all the results have been declared.
We instead present to you the results picture of those of our holding companies which have reported so far.

Download EBIT Q2 FY27 data (Excel spreadsheet)
Please note that the revenue equivalent for financials here is Net Interest Income and for EBIT the equivalent is Pre Provisions Operating Profit. As you can see, the results are very strong. We have not adjusted for the lower treasury income in HDFC Bank and presented the numbers as they were reported. Only two thirds of our portfolio by average weight have reported so far and we will give a complete picture next month. It is kind of perplexing that a vast majority of our portfolio is trading at the low end of their historical valuations despite such strong growth
Meanwhile other data seems to support the thesis that the 20% growth shown by the BSE-500 ex-financials ex energy in revenues and profits in June 2026 quarter, is continuing into the September quarter. Advance corporation tax collections, a measure of overall profit growth, both for listed and unlisted companies grew by 18.1% from 1st April to 17th September 2026. Credit growth for the banking sector for the fortnight ended 15th October 2026 was 18.2% and the deposit growth was 16.7%. GST collections on the domestic side have grown at 9.8% in the last 3 months. When we factor in that GST rates were cut massively on 22 Sep 2025, this represents impressive growth. So, all the evidence suggests that the corporate sector is recording growth rates not seen for about 15 years, barring the blips on a low base during covid. Yet the market is falling and valuations are crunched. Why?
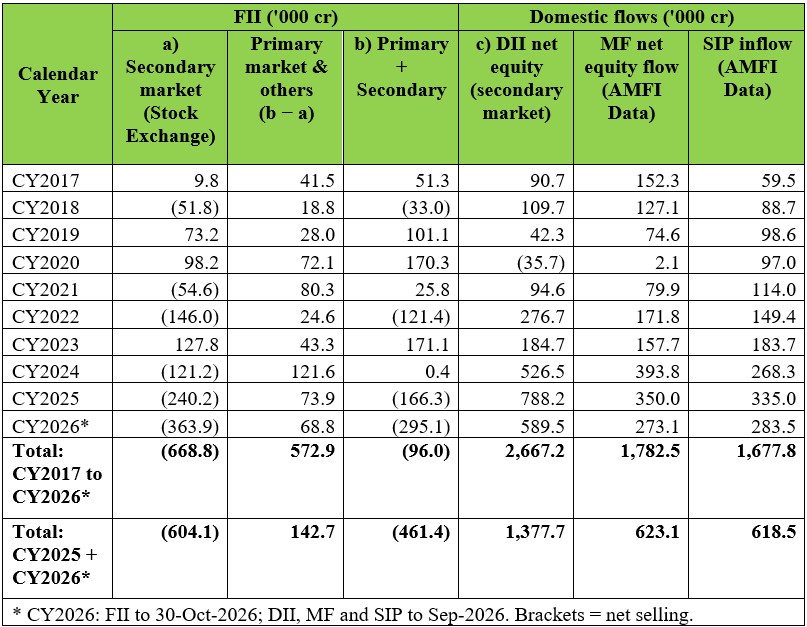
We think one of the big reasons that the market remains depressed despite such impressive growth numbers seems to be persistent FII selling. Oil could be one factor affecting sentiment, but when we consider that oil was above $100 in 2022 as well as in 2014, after 12 years have passed the CAGR growth in crude oil prices for us would probably be lower than generalized inflation in India. Also, petrol and diesel prices were raised in India during the Ukraine war itself and were not really brought down much when crude oil retreated in international markets. So, we have not had a very large impact on the retail price of diesel and petrol post the Iran war. Availability of gas also does not seem to be an issue, as it was in March 2026. So, the likely reason for the market to fall could be FII selling. Below, we present the FII purchase/sales for the last 10 calendar years in two columns – a) only secondary market and b) primary and secondary market together. Also we have added columns for domestic equity flows.
Download Domestic equity flows data (Excel spreadsheet)
The net FII sales in the secondary market over the last 10 years (CY2026 only up to October) are Rs 6,68,817 cr. If we include the money they have put into the primary markets (IPOs etc), then the net sales for the last 10 years are 95,962 cr. The selling has particularly been brutal over the last 2 years and may in part explain the weakness of the Indian equity market. This only partly explains the weakness because as we noted in our August 2024 newsletter, 47% of the BSE500 constituents had a PE ratio above 50 then. So, the dominant factor for the fall may be the high valuation at the top but the supply to make this come about, was perhaps the FII selling.
Why have FIIs been selling?
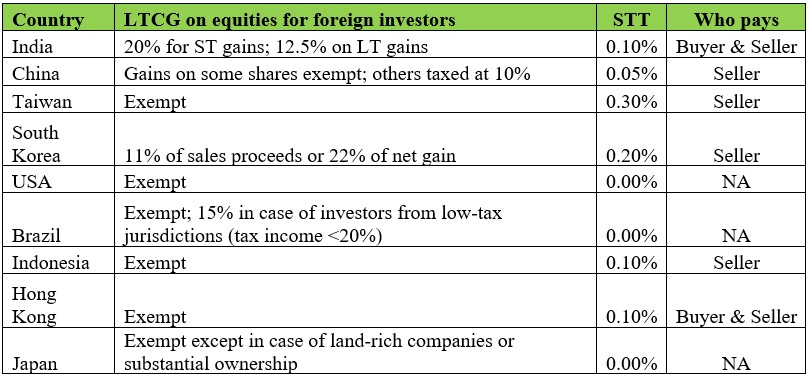
We are not sure anyone knows the definitive answer to this question. It could be the high valuations which were prevailing in 2024, but the continued selling into 2025 and 2026 when now valuations look attractive to us, is perhaps for some other reason. One reason which has been making the rounds of late, is the unfavourable tax regime that FIIs have to deal with, when investing in India. Two market veterans Akash Prakash of Amansa Capital and Ajit Dayal of Quantum Advisors wrote op-ed pieces in the Indian media talking about how FIIs do not pay capital gains taxes in most other jurisdictions in the world and the tax and the compliance around it, is quoted as a big burden by these two gentlemen, both of whom have large FII funds invested in India. Below we present an extract from a Jeffries presentation, talking about the tax treatment for long term capital gains in different jurisdictions in the world.
Download capital gains in different data (Excel spreadsheet)
The other reason that FIIs could be selling Indian stocks is that globally we are seeing emerging market flows dry up and a lot of that money is finding its way into US, particularly the tech sector. The AI trade is the big buzzword around markets today. We know almost nothing about this technology and its technical details. So, if you think that disqualifies us, you are well within your rights to think so. Yet, do hear us out. We will try to talk about the financial aspects of the AI boom that we are witnessing. We can try to draw parallels from another time, the dot com boom when also a revolutionary technology had its hey-day on the international markets, but very common place in our lives today – the internet. The one thing that we notice from our financial hat, is the depreciation of assets over their lifetimes for these two different times (whether comparable or not, we don’t know). The fibre optic cables that were laid down during the late nineties are still in use after more than 25 years today, with minor incremental capex along the way. From whatever little we understand, the remaining useful lives of GPUs are likely to be substantially lower than 25 years plus that the fibre optic cable has had. Thus, we believe that it is very important to look at the capex requirements of the AI boom.
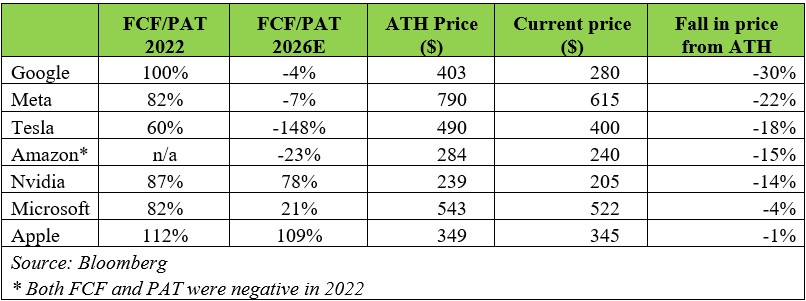
Below we present the Free Cash flow to Net Profit of the ‘Magnificent Seven’, a name given to the group of mega caps in the US, which dominates the US stock market. Free cash flow is Net Profit plus Depreciation minus the capex of the company, and it is a measure of what cash remains with the company to distribute to shareholders as dividends or buybacks. When it turns negative, the cash needs to be raised through debt or equity.
Magnificent Seven
Download Magnificent Seven data (Excel spreadsheet)
What we see from this table is that the Magnificent Seven, most of whom were free cash flow machines in 2022 before the advent of ChatGPT, many of them have seen their FCF/Net Profit ratio fall dramatically or even turn negative in FY2026E as per consensus estimates of analysts on Bloomberg. Co-incidentally the ones whose free cash flows are more intact, have done relatively better on the market as of today. This picture could of course change with time. What is clear is that the capex for the AI boom is placing some stress even on these magnificent cash flow machines.
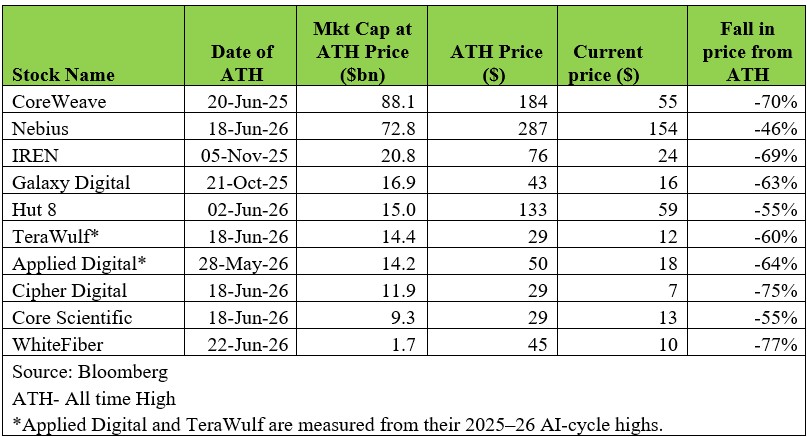
We now look at the performance of some of the large data centre-related stocks and their performance from their all-time highs (ATHs). Now, while fall from an ATH may not be the most correct comparison because a stock that went more wild on the upside than some other stock, may fall relatively more from its ATH. However, it does bring all stocks to an equal comparison to some extent in the sense that the market in its own wisdom takes some stocks upwards wildly and those are often the stocks which suffer the most in the downturn.
Download Fall in price from ATH data (Excel spreadsheet)
Below are the list of IPOs and other fund raises which have faced some hurdles in subscription or been pulled back by merchant bankers for an appropriate time.
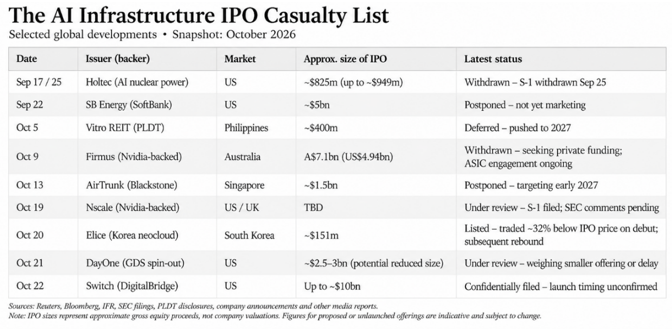
It appears from this that some cracks are beginning to appear in the AI trade. While again, we are not best placed to understand why this may be happening, two data points did catch our eye. One was that as per a news item that we read, in the week ended Sep 27, 2026, the top Chinese models processed 76.1 trillion tokens on Openrouter, a global aggregator platform, up from 4.4 trillion tokens in April 2026 while leading US models processed 14.2 trillion tokens in the week ended Sep 27, 2026. Thus, although we are not comparing apples to apples here, on this very rough basis, the lower cost Chinese tokens enjoyed more than 80% market share. Increasingly organisations are optimizing their token usage strategy to farm out less critical work to cheaper models. Yet this massive market share that the Chinese models have, opens up questions about the monetization strategy of the US models.
The other data point which came to our attention is the price of tokens as represented by the LLM Token Expenditure Index, which is a daily statistical benchmark designed to measure the effective expenditure level of the actively traded LLM market measuring prices per million tokens. Below we present a graph of these prices since its inception on Dec 31, 2025.
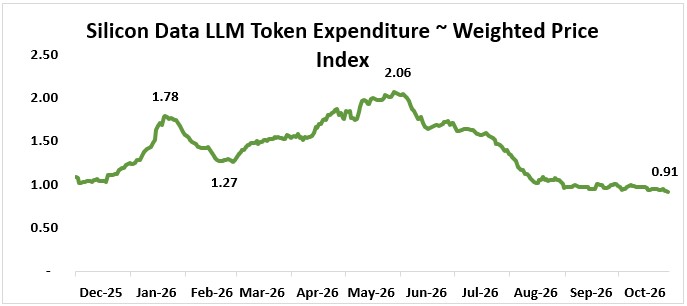
As we can see from this graph, there is a significant fall in this index from $2.06 at the high in May 2026 to $0.91 now. Again, we do not have the technical expertise to understand how this affects the economics of Anthropic and OpenAI and the accompanying ecosystem, but such a steep fall in prices doesn’t sound like good news in a sector which is anyway burning a lot of cash and investing a lot of capex in a bright and unknown future.
Is this a bubble?
It is difficult to say when something is a bubble while you are still experiencing one of these big technologies led booms. As per the Gartner Hype Cycle, any new technology goes through a 5-phase cycle of innovation, peak of inflated expectations, a trough of disillusionment, slope of enlightenment (when real benefits become clearer and better understood and the plateau of productivity when the technology reaches mainstream adoption and becomes part of normal practice, as we can perhaps say about the internet now. Which phase one is in, is very hard to say while you are experiencing it. But whether there have been inflated expectations becomes clear from anecdotal evidence like SanDisk going up 49.4x in one year (at its peak). Such large price increases for substantial size companies in such a short period have been seen in bubbles in the past. We don’t know how much more the bubble still has, to inflate, because we don’t understand the technology underlying the AI boom, but the Shiller PE at the peak of 2026 was 41.0 as compared to the Shiller PE of 44.2 at the peak in the dot come bubble in 2000, marks a red flag to be watchful of.
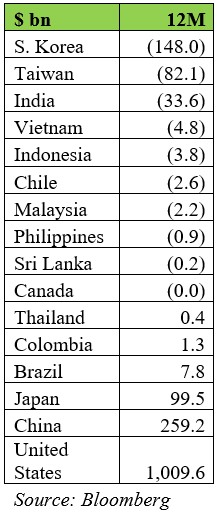
The AI boom has led to US being the primary recipient of global flows in recent times. The table below gives the total FII flow over the last 12 months into different global markets. A negative number implies an outflow.
Download negative number implies an outflow data (Excel spreadsheet)
As we can see, US, China and Japan are the large recipients of inflows over the last 12 months while most of the emerging markets have experienced outflows. This seems largely led by flows into the US tech sector. If and when the crack in the AI boom becomes more visible, some of these flows may reverse.
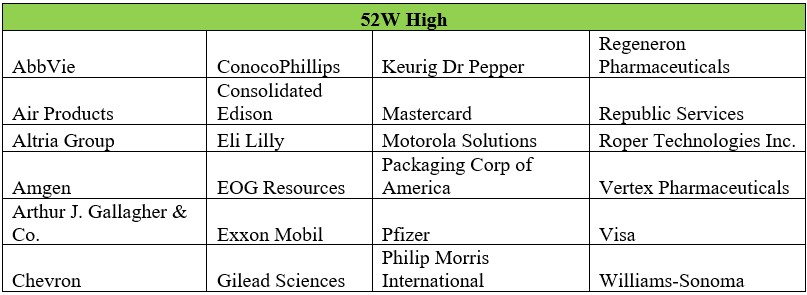
On the last day of the month, as we wrap up this newsletter, we find that the S&P has fallen 1.8% for the day and Nasdaq100 is down 3.5% for the day. Sharp falls have been seen over the last few days in many mega caps like Google, Meta, Amazon, Oracle, Intel and Broadcom to name a few. On the same day, have a look at the 52-week highs for stocks in the S&P500
Download 52W High data (Excel spreadsheet)
There are some of the boring quality/value stocks, which have underperformed for some time, finally making some sort of a comeback. On a day when the indices fell so sharply only two stocks made a 52 week low – Coinbase and CRH. And so many stocks, which belong largely either to the oil sector, or are generally high quality companies are making 52 week highs. That they are making 52 week highs on a day when techs fell sharply could be pointing to the fact that quality stocks are making a comeback just as momentum stocks retreat.
This brings us to the chapter called “The Resilient Investor” in the book “Richer, Wiser, Happier” that we had gifted to our clients on our 20th Anniversary. This chapter is about Jean-Marie Eveillard, a famous value investor, who went through a lot of pain leading up to the 2000 peak because he had zero exposure to tech stocks. However, the subsequent years proved very fruitful in terms of portfolio returns, because he had a bunch of value stocks in his portfolio which had underperformed for some time because momentum stocks were in favour leading up to the dot com peak. We urge you to read that chapter again. In case you did not receive your copy of the book, please write to us and we will courier it to you. It is hard to say how much more this AI bubble still has left in it because we don’t understand the underlying technological change so well, but some cracks are beginning to appear in the data centre infrastructure stocks and IPOs and also in some of the Magnificent Seven stocks and we will continue to watch the space to see how the story unfolds.
What impact does all this have on our portfolio?
We do not know if an AI bust is under way or not. The tech stocks have bounced back from such sell-offs in the past and it is difficult to say what will happen next. If these initial cracks in the AI trade widen, we expect some of the strong inflows going into the US tech sector to reverse, thus allowing more money to flow to emerging markets, including India. India has often been referred to as the anti-AI play because of lack of exposure to AI and sure enough the Nifty was mildly positive while Nasdaq futures were down big on Friday and for Monday too the GIFT Nifty futures are pointing to a positive open. There is already an on-going move towards quality/value as we are seeing from the 52-week highs in the US market on 30 October 2026. This could be a precursor to a similar move in India where value/quality stocks have underperformed the momentum stocks and just like Eveillard experienced in the years after 2000, this could lead to quality stocks trading at low valuations, doing well over the next few years. We remain confident of our portfolio choices and the valuations that they are trading at, and we think that this is a great opportunity for you to add money to your portfolio with us.